CEO Pay: How Much Do CEOs Make Compared to Their Employees?
Employee Sentiment and Communication Around CEO Pay
What's Your Earning Potential?
What's Your Earning Potential?
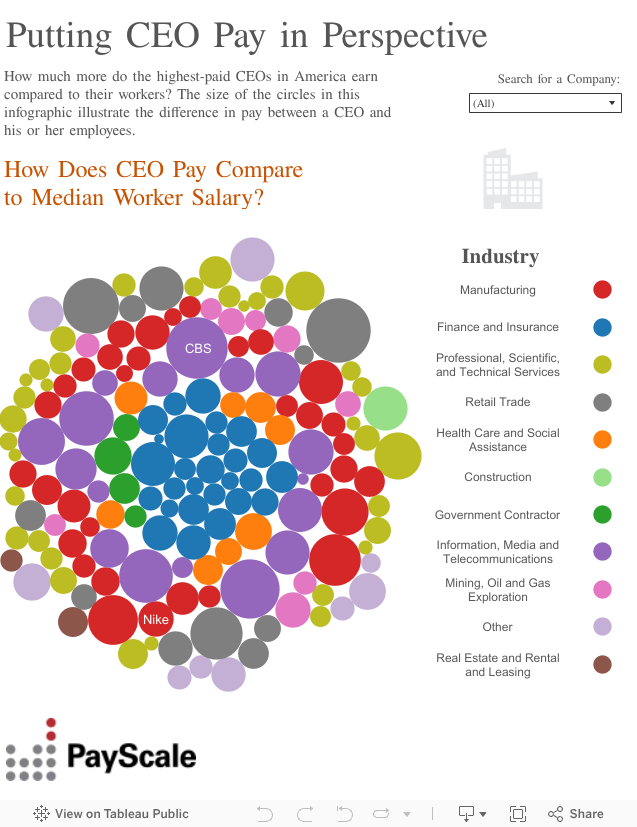
CEO pay in the U.S. has grown exponentially since the 1970s, according to the Economic Policy Institute (EPI), rising almost 1,000 percent compared to a rise in worker salaries of roughly 11 percent over the same time period (adjusted for inflation.) Starting next year, the Dodd-Frank Act, enforced by the Securities and Exchange Commission (SEC), will require publicly traded companies to publish their CEO-to-worker pay ratio, a move that could bring this issue further into the public consciousness. To get a sense of what might be revealed once companies begin reporting this new information, PayScale partnered with Equilar, a leader in executive compensation and corporate governance data solutions, to calculate ratios for some of the highest-paid CEOs in the U.S. Only companies with annual revenue over $1 billion were considered. PayScale also surveyed employees to find out how they feel about their CEO's compensation, and talked to a few CEOs (including our own) to understand how they communicate to employees about executive pay today.
The average CEO-to-worker pay ratio for the 168 companies included in this report stands at about about 70-to-1, with some CEOs making more than 300 times the median salary of their employees – just in cash (base pay, bonuses, profit sharing, etc.). Many CEOs receive substantial stock/option grants and perks as part of their compensation, which can more than quadruple their total annual pay. But similar data for employees by company is not readily available, so we looked solely at cash compensation for both CEOs and workers to calculate ratios for this report.
Larry Merlo, the CEO of CVS Health Corp, made roughly 434 times the salary of the median CVS employee in 2015, the largest ratio between CEO and employee pay at any company on this list.
It wasn't always this way. In 1965, the CEO-to-worker compensation ratio in the United States stood at about 20-to-1, according to a 2015 report by the EPI. But starting in the 1970s up through 2014, "inflation-adjusted CEO compensation increased 997 percent, a rise almost double stock market growth and substantially greater than the painfully slow 10.9 percent growth in a typical worker's annual compensation over the same period."
Is this a problem? Is it out of line for the Chief Executive of a successful company to be paid hundreds of times the salary of his or her average employee? Or is CEO a demanding enough job requiring such a highly developed skillset that these high salaries are deserved?
"Excessive executive pay is deservedly blamed for rising income inequality, because worker pay has stagnated as executive pay has soared," said the New York Times in a July 14 editorial. Additionally, the idea that the inequality between executive and worker pay is contributing to the downfall of the American middle class has been prevalent on the campaign trail this election year.
But not everyone sees the disparity as an issue. Some even question the validity of the data, pointing out the pay of a CEO at an average company is only about four-times higher than the average American worker, a decidedly more balanced ratio than found at the largest firms. The problem there, however, is that the average firm is very small, employing just 20 workers, and workers at those companies are not representative of the typical American employee. Again, according to the EPI report, a typical American worker "works in a firm with roughly 1,000 workers. Half (52 percent) of employment and 58 percent of total payroll are in firms with more than 500 or more employees. Firms with at least 10,000 workers provide 27.9 percent of all employment and 31.4 percent of all payroll."
Last year the SEC finalized a section of 2010's Dodd-Frank Wall Street Reform and Consumer Protection Act designed to increase transparency into executive compensation by requiring publicly traded companies to publish, in addition to CEO pay figures, median worker pay and the ratio between CEO and median worker pay. By law, this data will be shared starting in 2017. (The Dodd-Frank Act was passed in response to the economic crisis of the late 2000s in an effort to avoid widespread financial collapse.)