Research Reports
In the 2025 Q3 Index for the United States you’ll see:
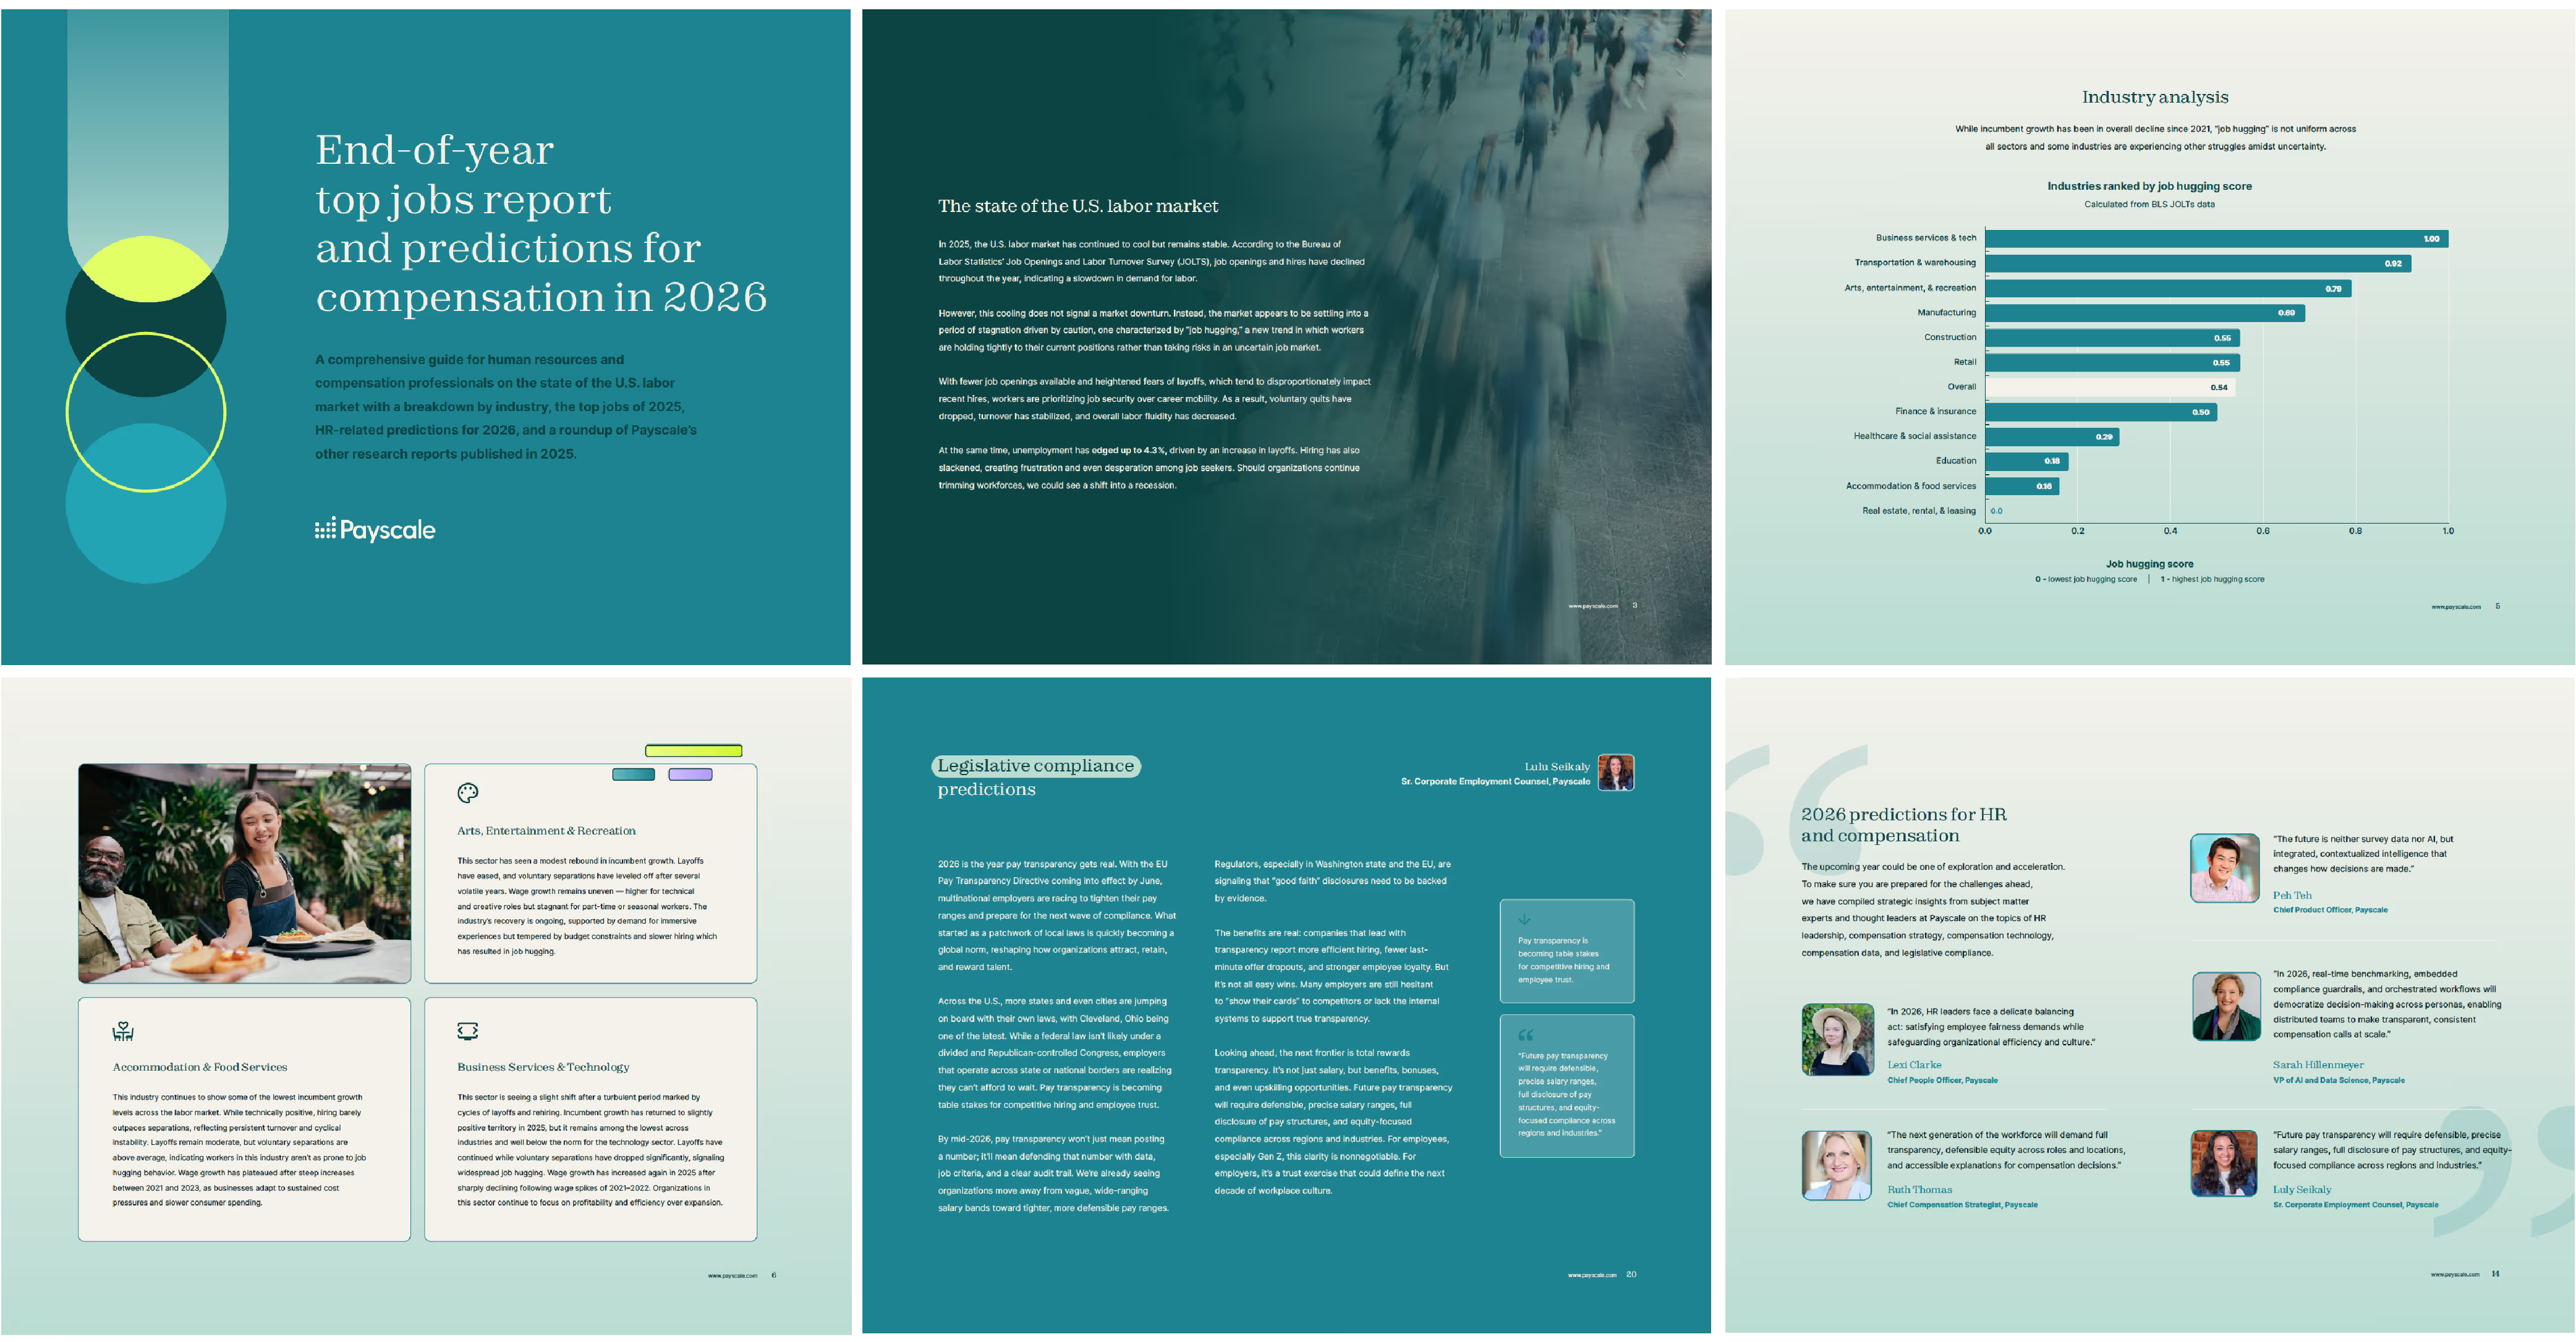
Payscale’s 2025 Q3 Index provides insights into actual increase data from 2024 and planned increase data for 2025. Additionally, it features segmented analysis by:
- Nominal wage growth for 2025 Q3
- Highlights of regional wage growth for 2025 Q3
- Highlights of wage growth by job category
- Highlights of wage growth by industry
Download now
The ID is set to default '5900', don't forget to update it if needed.