Salary increase budgets to decline in 2026
U.S. employers plan on 3.5 percent salary budget increases for 2026. Canada employers plan on 3.3 percent increases. For the United States, this is 0.1 percent lower than what employers say they actually gave in 2025 and unchanged from when we asked about the 2025 plan in 2024.
For Canada, planned increases for 2026 are also 0.1 percent lower than what employers actually gave in 2025 and the same as what was planned for 2025 in 2024.
In prior years, salary increases declined because inflation was dropping and wages were rising. However, this year, concern over the economy and labor market conditions favoring employers is why salary increases are diminishing or stagnating despite indications that inflation may be on the rise.


Understanding different pay increase types
We also ask about different types of pay increases as not all organizations follow the same strategy or give pay increases for the same reasons. For base-pay increases, we ask about merit increases, cost of living increases (inflation), other types of increases, and total increases, which are self-reported. We also ask for promotional increases and salary structure increases.
- COLA increases: Cost-of-living pay increases that are granted to all eligible employees to keep up with inflation.
- Merit increases: Pay increases granted based on individual employee performance.
- Other increases: Any other pay increase granted during the course of the year, such as for pay equity or market adjustments.
- Total increases: The sum of pay increases granted over the course of the year. This is self-reported by respondents and not a calculation.
- Salary structure increases: Pay increases made to salary structure control points to align structures with current market rates.
- Promotional increases: Pay increases given to promoted employees.

US: Reasons for salary budget changes
In the United States, only a small portion of organizations (16 percent) anticipate a salary increase budget that is higher than last year, which is a decrease of 3 percent YOY. A strong majority of organizations (68 percent) expect salary budgets to remain the same while a small increase expects them to be lower.

The primary reason organizations in the United States said they plan to lower pay increases is concern about economic conditions (66 percent), which has seen a 17 percent increase since last year’s report. In previous years, the leading reason was that higher pay increases were given the year before, due to the rising cost of labor and inflation, which has gone down by 18 percent.
Organizations planning to give higher pay increases are more split on their reasons, but it is notable that there has been a 19 percent drop in increased competition for labor or labor supply shortages, which used to be the primary reason for giving higher pay increases.

CA: Reasons for salary budget changes
In Canada, only a small portion of organizations (10 percent) anticipate a salary increase budget that is higher than last year, which is 3 percent lower YOY. The majority of organizations (74 percent) expect salary budgets to remain the same.
In Canada, the primary reason organizations said they lowered pay increases is concern about future economic conditions and business performance at 76 percent, which is an increase of 35 percent YOY, followed by increases being higher than usual the prior year (31 percent), which has dropped 28 percent YOY.

Salary budgets around the world
In our survey, we also ask for salary budget increases for employees in other countries where respondents manage pay.
Pay increases are expected to be higher in countries like Brazil where inflation continues to drive up the cost of labor, or due to government initiatives to raise wages like in China, or in India which is seeing high economic growth related to demand for technology talent, while dropping in countries with cooling labor markets.
Notably, wages remain higher than 3 percent around the world, which has become the new standard since the COVID-19 pandemic caused worldwide inflation that has yet to reach a 2 percent target in most countries.

US: Salary budgets by industry
We also segment our Salary Budget Survey data by industry. Notably, the Technology industry is seeing a 0.5 percent decrease in planned pay increases for 2026 compared to 2025, which is a shift from previous years where the Technology industry showed higher pay increases more consistently compared to other industries. We also see lower than average pay increases in Education and Food, Beverage, & Hospitality compared to other industries.
Note: Industry cuts are derived. Counts must number at least five participants for data to be included. Especially high pay increases for one participant can sometimes skew averages.

Comparison to wage growth and inflation
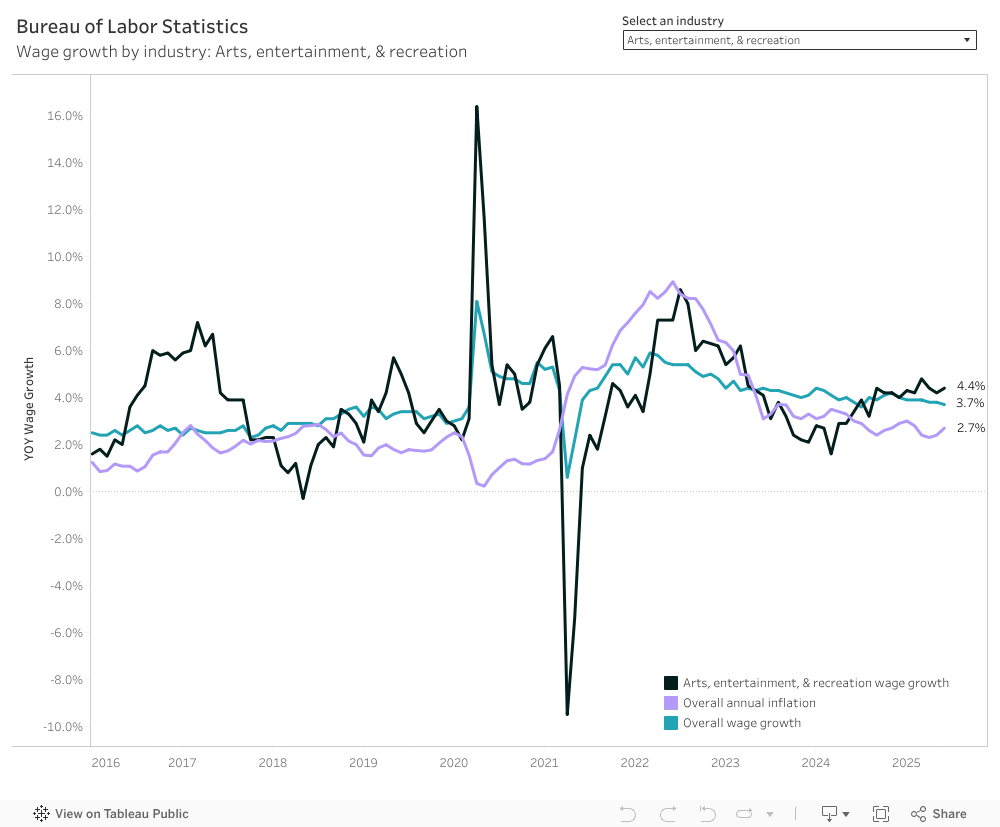
We also looked at wage growth and inflation from the Bureau of Labor Statistics (BLS) through June 2025, both overall and by industry, to provide context for understanding planned base-pay increases and where they might exceed or fall short of employee expectations and market dynamics. The selected industries shown are among those available for reporting and suitable comparison within the BLS Current Employment Statistics Survey.
We find that wage growth from the Bureau of Labor Statistics exceeds planned base-pay increases in our Salary Budget Survey for most industries, including Arts, Entertainment, & Recreation, Business Services, Finance & Insurance, Food, Beverage & Hospitality, Healthcare & Social Assistance, Manufacturing, and Retail.
Industries where planned pay increases are higher than current wage growth include Construction, Pharma & Biotech, Real Estate, and Transportation & Warehousing.
Engineering & Science matched up in both datasets.
Note: Industries not represented individually within the BLS Current Employment Statistics for comparison include Agencies & Consultancies, Education, Energies & Utilities, Government, Nonprofits, Technology, and Telecommunications.
Wage growth may exceed planned pay increases in some sectors and not others due to rapidly changing job market dynamics. For example, industries where skilled labor is in high demand often see higher wage growth due to higher salary offers. When pay increases for current employees do not keep up with the market, organizations are at risk of attrition.
Conversely, wage growth may fall due to increased economic uncertainty, loss of funding (particularly in sectors dependent on government funding such as Construction and Pharma & Biotech), and automation, outsourcing, or an overabundance of qualified talent.
Employers are advised to consult multiple salary data resources both for market pricing jobs and planning for pay increases to build confidence in pay decisions.
To learn how Payscale can help, ask for a demo.
Methodology
Payscale clients and contacts were invited to participate in our Salary Budget Survey (SBS) in May-June 2025 via email. Submissions were accepted through June 15th, resulting in 1,551 usable submissions.

Respondents were asked to submit data for the U.S., Canada, and select international locations for the following employee groups:
- All employees
- Non-exempt employees
- Exempt (non-management) employees
- Managers
- Officers & executives
Respondents were instructed to enter no response for increase programs that do not exist in or were not applicable to their organization, and to enter a response of “0%” for programs that exist but were budgeted to receive no increase for the year in question. “0%” responses were included in the calculations for the figures reported here.
Note that a minimum of five responding organizations were required to publish each of the above statistics. Only one response per organization was used for analysis.
Respondents were asked to self-identify into a pre-defined industry, company type, and size classifications.
Statistics for the following increase programs were collected as an average across all respondents for a given data cut. The data for these programs are entirely self-reported:
- Inflation/cost of living increases: Base-pay increases that are granted to employees, typically in an “across-the-board” manner, to account for inflation. Respondents were asked:
As a percentage of base-pay, what is/will be the typical Inflation/COLA increase in [year] for [employee type]?
- Merit increases: Base-pay increases granted based on individual employee performance. Respondents were asked:
As a percentage of base-pay, what is/will be the typical Merit increase in [year] for [employee type]?
- Other increases: Any other base-pay increase granted during the course of the year (for example, equity or market adjustments). Respondents were asked:
As a percentage of base-pay, what is/will be the typical Other increase in [year] for [employee type]?
- Total increases: The sum of base-pay increases granted over the course of the year. This is self-reported by respondents and not a calculation derived from the other increase programs. Not all organizations offer all types of increases. As a result, Total increases reported may not equal the sum of Cost of Living, Merit, and Other increases reported. Respondents were asked:
As a percentage of base-pay, what is/will be the typical Total increase in [year] for [employee type]?
- Salary structure increases: Increases made to salary structure control points in order to align structures with current market rates. Respondents were asked:
What is/will be the typical salary structure increase in [year] for [employee type]?
- Promotional increases: Pay increases given to employees who have been promoted. Respondents were asked:
As a percentage of base-pay, what is/will be the typical promotional increase given to promoted employees in [date]?
Nominal wage growth is not adjusted for inflation. We include wage growth data since 2016 sourced from the Bureau of Labor Statistics (CES) to compare and validate findings from SBS results. The selected industries shown are among those available for reporting and suitable comparison within the BLS Current Employment Statistics Survey. We also include CPI inflation data sourced from the BLS for added insight.
Payscale is the original compensation innovator for organizations who want to scale their business with pay and transform their largest investment into their greatest advantage. With decades of innovation in sourcing reputable data and developing AI-powered tools, Payscale delivers actionable insights that turn pay from a cost to a catalyst. Its suite of solutions — Payfactors, Marketpay, and Paycycle — empower 65% of the top companies in the U.S. and businesses like Panasonic, ZoomInfo, Chipotle, AccentCare, University of Washington, American Airlines, and TJX Companies.
Download the report
The full report provides segmentation of salary increase budgets and salary structure adjustments by industry, revenue, organization size, organization type, region, and state or province for the United States and Canada. It also contains salary budget trends, promotional increases for the previous year, and planned salary structure increases.
Get notified to participate next year
Sign up to participate in the 2026-2027 Salary Budget Survey.