




Everyone has data.
What they lack is confidence.
Timely, transparent data
for confident compensation
Build your confidence on intelligent data
Payscale bridges trusted survey methodology with the pace of modern business — delivering compensation intelligence leaders can stand behind: transparent, traceable, and defensible decisions made in seconds, not cycles.

Companies trust Payscale to make critical compensation decisions


Compensation data that never stops moving
Most compensation systems still rely on static, annual snapshots that are already outdated by the time they reach you. Payscale built something different — a living, layered data ecosystem designed to support every decision.
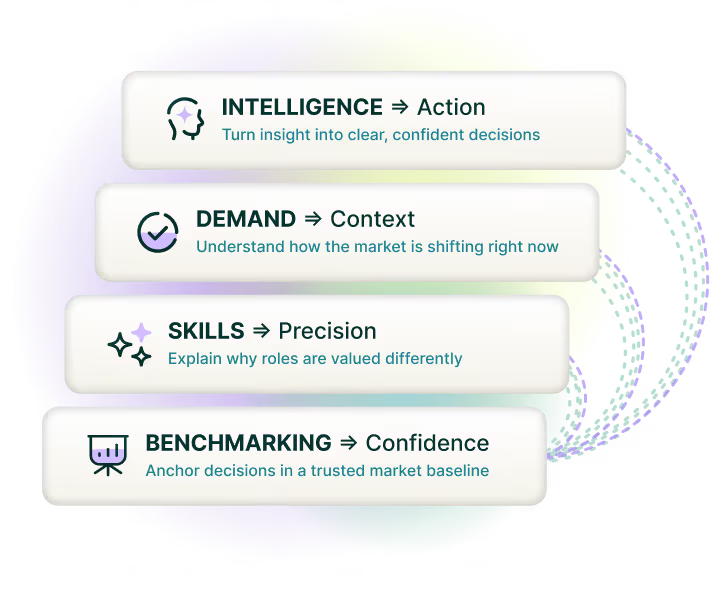
Transparent, traceable and defensible compensation intelligence that supports every decision:
- Fresh, industry-specific peer benchmarking data refreshed daily with traceable sources.
- Compensable factors that reveal why roles are valued differently across markets and industries.
- Continuously updated signals that show how demand within the market is shifting right now — from hot skills to emerging job trends.
See where the market is moving — right now
Coverage you can map. Insights you can act on. Refreshed every day from millions of employer-reported records — so your pay decisions reflect the market as it is today, not last year.


Four pillars – zero black boxes.
Every data point is traceable, explainable, and AI-enhanced for quality. Where the data comes from matters just as much as what it tells you.

Trusted sourcing
Tap into HR-sourced, survey-grade compensation data from thousands of real organizations that's contiously monitored with advanced tools for outlier detection and taxonomy validation. Every data point is traceable, so you can confidently defend every compensation decision.

Comprehensive coverage
How do you make the industry’s most comprehensive compensation datasets even better? AI-enhanced insights extend beyond traditional surveys to fill gaps and deepen market coverage across roles, industries, and geographies.

Continuously refreshed
Our foundational HR-sourced compensation data is continuously refreshed with the latest pay movements, emerging roles, and new organizational insights. This living intelligence gives you current, relevant benchmarks so you can make confident decisions as the market evolves.

Dynamic scoping
Define your competitive set and surface precise data cuts for each role, industry, and location. Customizable without consulting fees — and your data asset improves over time instead of expiring.
One unified data ecosystem designed to power every compensation decision with confidence
Every dataset interconnects. Layer them together, or use what you need. All powered by the same trusted methodology.
Peer Data Ecosystem
Move beyond outdated surveys and embrace continuously updated market pricing for smarter decisions. Peer is like a traditional salary survey, but refreshed daily — sourced directly from participant HRIS systems, validated by a team of experts, and anchored to the organizations you select.
Everything is powered by Peer — continuously refreshed, HRIS-sourced, no manual submission, choose which competitors anchor your data cut.

Peer Markets
When your talent market crosses borders and local accuracy wins
- Deeper coverage in 15 high-demand markets
- UK, Mexico, Australia, Germany, France + more
- Country-specific filters, localized accuracy

Peer Industry
When your industry is the benchmark
- Industry-specific job taxonomy + filters
- Vertical filters general databases don't have
- Peer community + quarterly events

Peer Enhanced
When data needs comp expertise built in
- Geographic and location differentials — job by job
- Regression analysis to normalize outliers
- Consistent coverage across every role — the comp work, built in

Peer Global
When the market moves faster than your survey cycle
- No survey to fill out — data flows directly from HRIS systems
- Choose which organizations anchor your data cut
- Coverage for emerging roles that haven't made it into surveys yet
Don’t just take our word for it
Hear from leaders how Payscale delivers for clarity, scale, and trust in their compensation strategy.


.png)
.png)


Enterprise-grade security, built in
Protecting comp data is non-negotiable. Payscale meets global compliance standards (GDPR, CCPA, CPRA), holds SOC 2 + TX-RAMP certifications, and runs annual third-party penetration testing, all backed by 24/7 in-house monitoring.


Frequently asked questions

Payscale Peer Global is an employer-reported compensation dataset sourced directly from the HRIS systems of participating organizations, validated by compensation professionals, and refreshed continuously. It is the foundation of the Peer Data Ecosystem and powers benchmarking, job architecture, and planning across Payscale Intelligence Cloud.
Employer-reported. Peer Global is sourced from participating organizations' HRIS systems, not from employees self-reporting their own pay.
Payscale also operates a separate consumer salary survey for individuals, but that is not the dataset behind Peer Global or Payscale's benchmarking products. When you price a role in Payscale, you are pricing against employer payroll records.
Traditional surveys publish annually and require manual submission. Peer Global flows from HRIS systems, updates continuously, and lets you choose which organizations anchor your data cut. You get survey-grade methodology at the pace of the market — without a survey cycle.
The Peer Data Ecosystem is one governed foundation with four layers: Peer Global, Peer Enhanced, Peer Markets, and Peer Industry. Layer them or use only what you need. All four connect to the same methodology, so your teams are not reconciling conflicting sources.
The core differences are sourcing and cadence. Peer Global is HRIS-sourced and refreshed daily rather than collected through annual survey cycles, and it requires no survey submission work from your team.
Established survey providers bring deep consulting relationships and long-standing survey libraries, which some organizations prefer — particularly for highly specialized executive roles where equity and long-term incentives dominate the package. Peer Global is built for teams that need current market data without dedicating analyst time to survey participation and manual consolidation. For teams with established survey practices, Peer Global gives you that continuous view into the market, year-round, that can supplement your annual surveys.
Incoming HRIS records pass automated outlier detection, job taxonomy matching, and expert review. Matches are recommended by AI models and confirmed by compensation professionals on Payscale's Data Development team. Every data point is designed to be traceable and explainable — not a black box.
Yes. Peer Global is built for decisions you can explain: named-organization cuts where permitted, visibility into which organizations sit in your data cut, confidence context, and a documented methodology you can take to legal, finance, and employees. Payscale maintains SOC-audited controls through AICPA, plus GDPR and CCPA/CPRA compliance.
The same data layer feeds Benchmarking, Job Management, and Compensation Planning, so ranges, architecture, and merit cycles stay aligned. You are not exporting a file into a second system to finish the work.
Three safeguards apply before any data reaches a user. Every data cut requires a minimum of five contributing companies. No single company may represent more than 50% of a cut. And an automated similarity check prevents new cuts that too closely resemble existing ones.
Together this means participation never reveals what any individual organization pays.


Data you can trust. Decisions you can defend.
See how Payscale’s living data ecosystem powers confident compensation for 10,000+ organizations worldwide.