


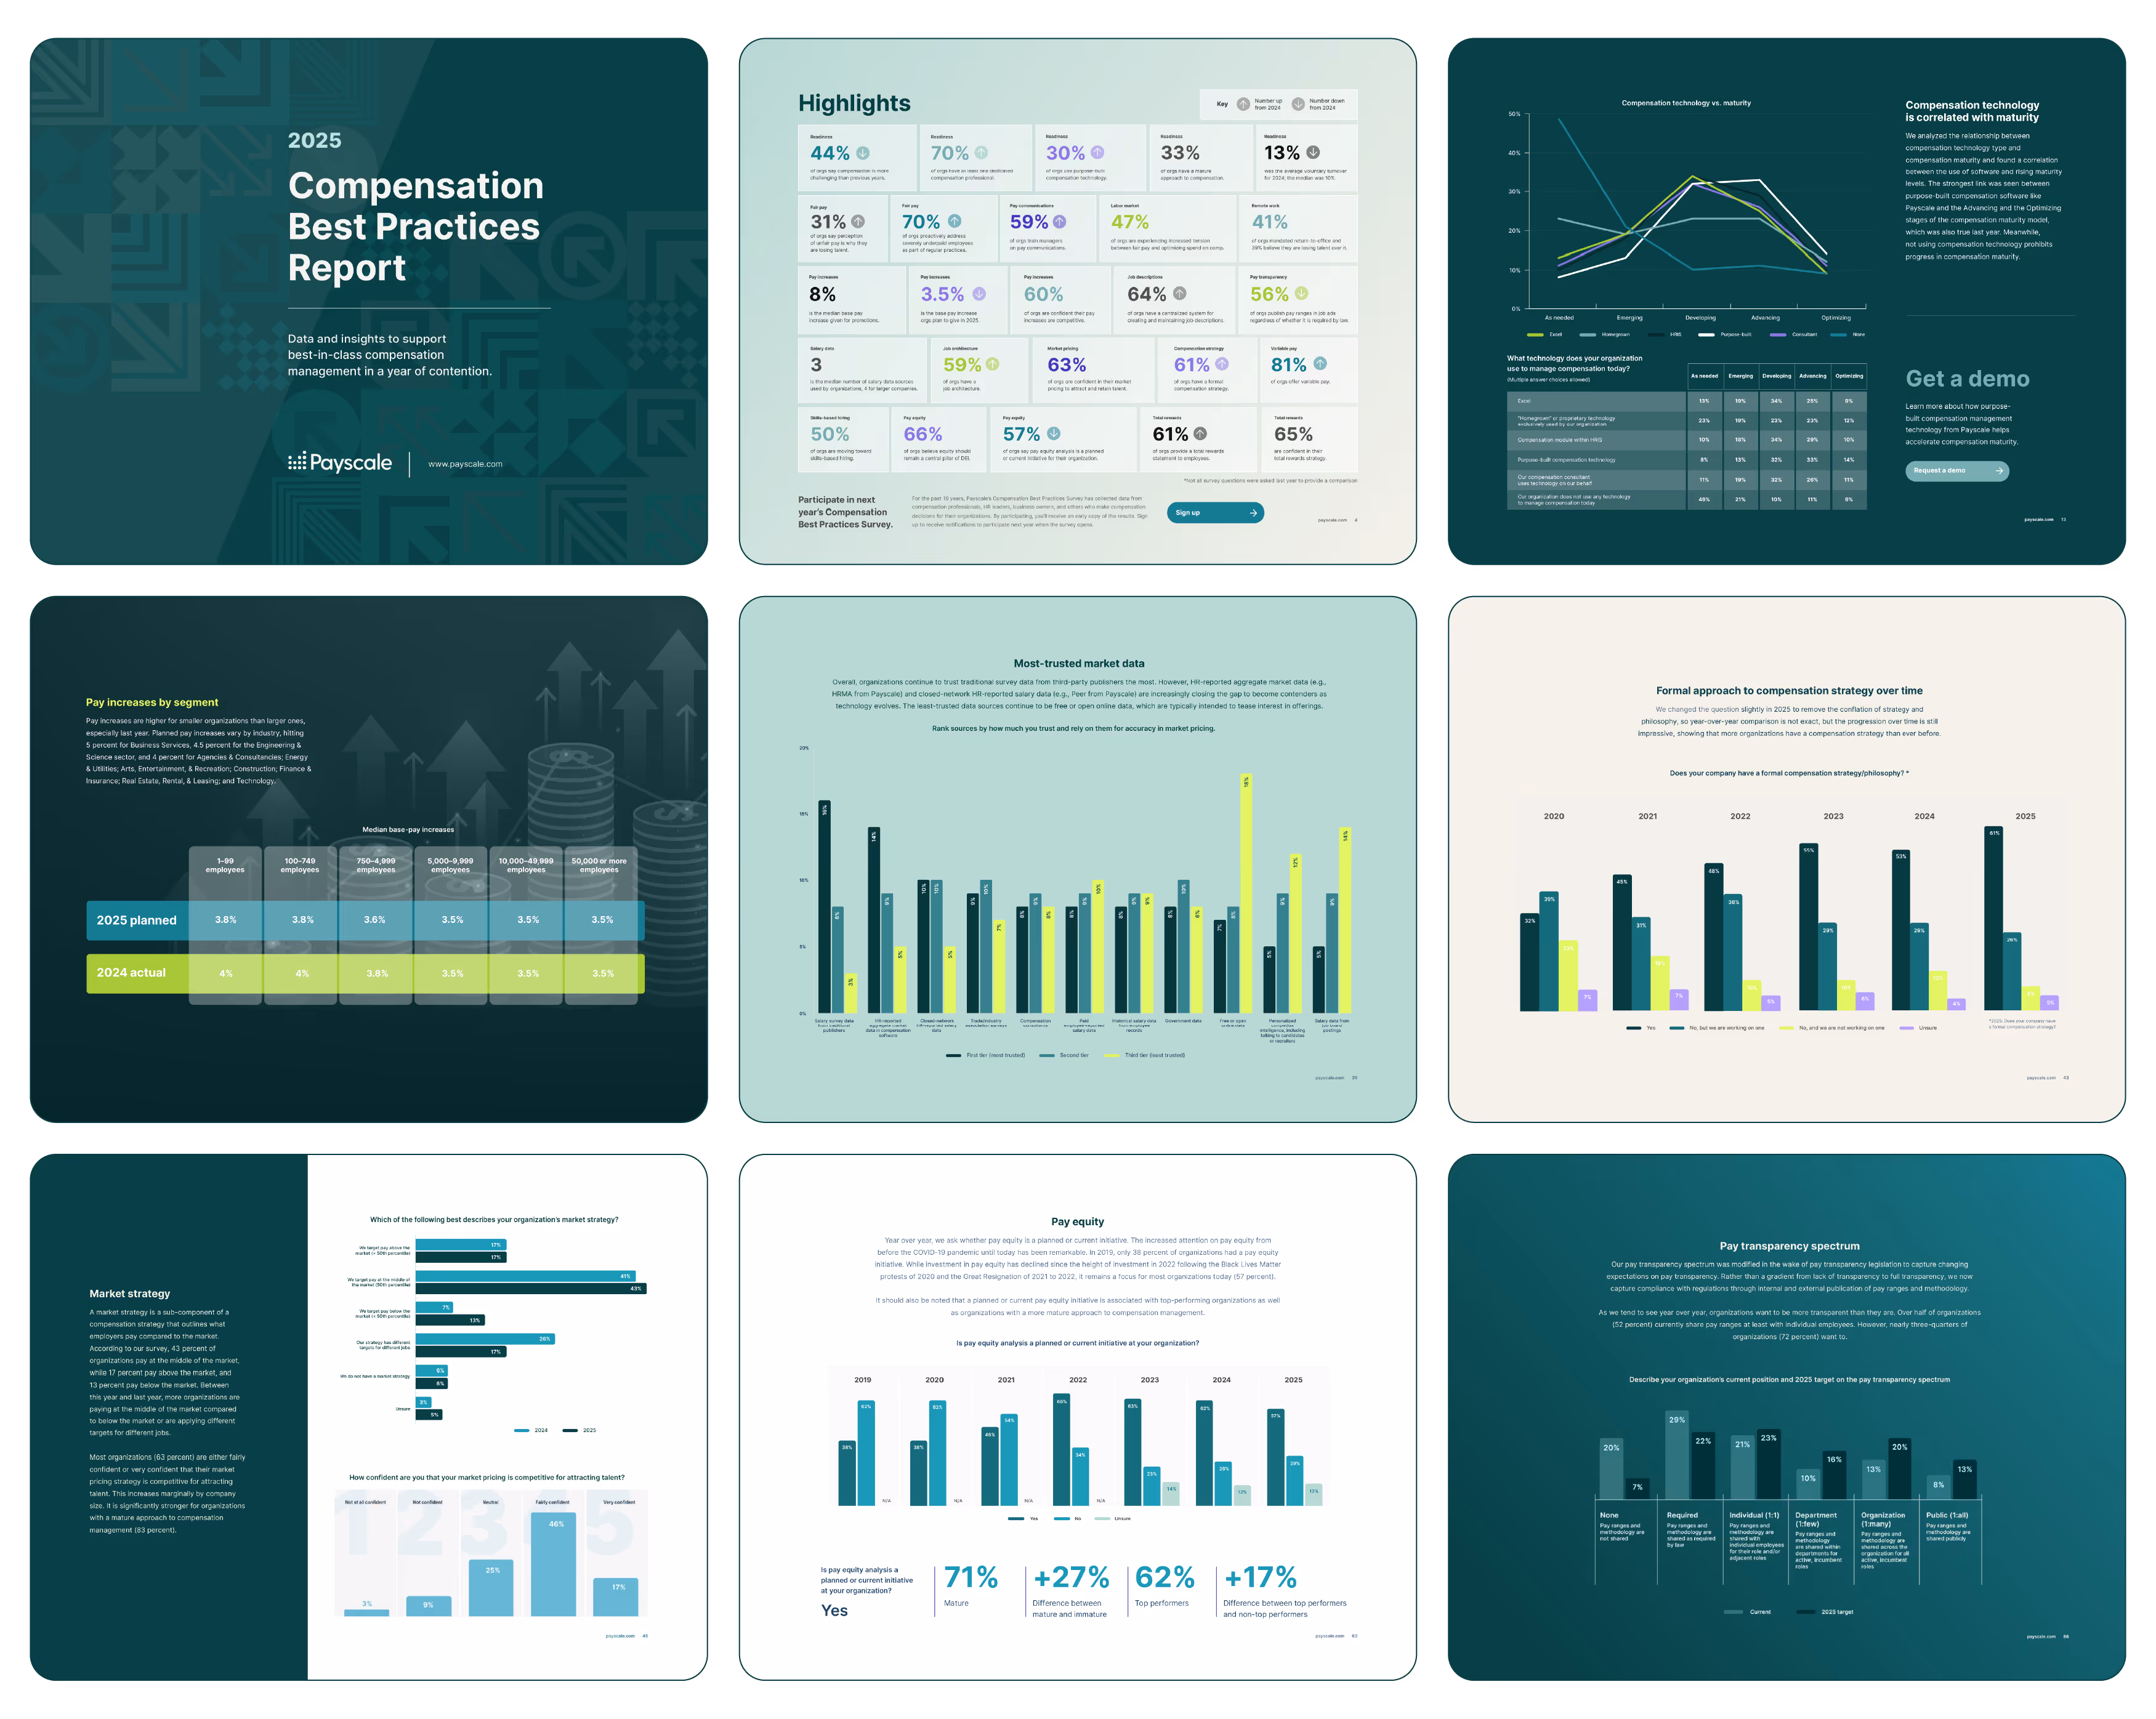
2025 End-of-Year Top Jobs Report
Payscale’s End-of-Year “Top Jobs” Report analyzes the state of the labor market in 2025 and the fastest growing jobs of the year by wages as well as the jobs people are seeking to quit. We also look at the top jobs recruiters are struggling to fill and which are seeing the highest growth in job postings.
While the top jobs lists are publicly available on this page, the full report also includes predictions for HR leaders and compensation professionals in 2026 as well as the top research reports of 2025.
Access the report

Summary
The state of the labor market is of high importance to HR leaders and compensation professionals, as the labor economy impacts workforce planning, salary offers, and pay increases, which are determined at the end of the year for most organizations that use the fiscal calendar.
This is also the time of year when compensation professionals review the results of salary surveys and make market adjustments for employees whose salaries need correction because salary ranges have moved due to market changes and pay compression.
In the End-of-Year Top Jobs Report, Payscale analyzes market data to see which jobs have experienced the fastest growing wages as well as which jobs employees are most looking to quit according to Payscale’s online salary survey, which captures both current salaries and salary offers for new jobs. We also look at job posting data in Lightcast to determine which jobs are hardest to fill and which are seeing the highest growth in job postings.
Overall, we find that the job market is tepid compared to previous years, with slower wage growth in the top positions, the highest being 12% where prior years saw as high as 30%. However, we are seeing a return of white-collar technology positions in the top jobs list this year after an absence from 2022 to 2024, which featured more blue-collar jobs.
For more details, see Methodology.
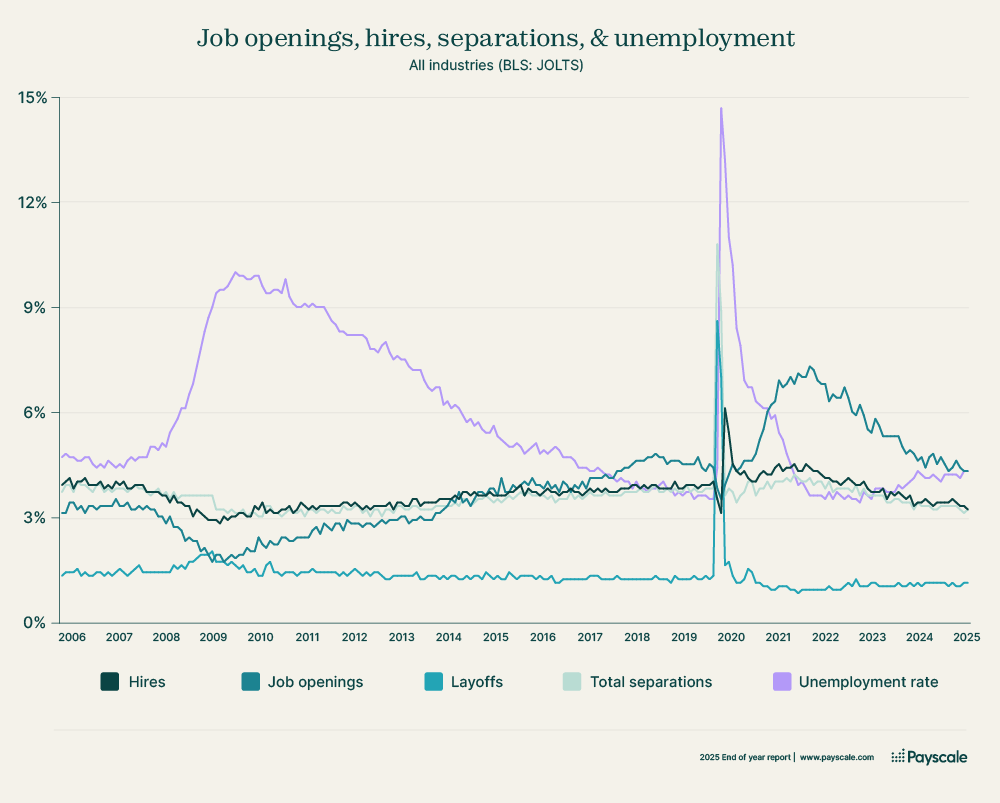
State of the U.S. labor market in 2025
To contextualize the state of the overall labor market, we have analyzed data sourced from the Bureau of Labor Statistics Job Openings and Labor Turnover Survey (JOLTS).
The labor market has cooled but has not collapsed. Job openings and hires have continued to shrink throughout 2025. Workers are staying in their jobs rather than risking the market to seek new opportunities. This is being referred to as “job hugging,” as people with jobs are not braving the market to seek employment with so little opportunity available, especially when there are also risks of layoffs, which tend to hit recent hires harder.
While total separations and layoffs remain steady, unemployment has crept up to 4.3% as layoffs have increased. Unemployment will increase further if organizations start laying off employees at the end of the year.
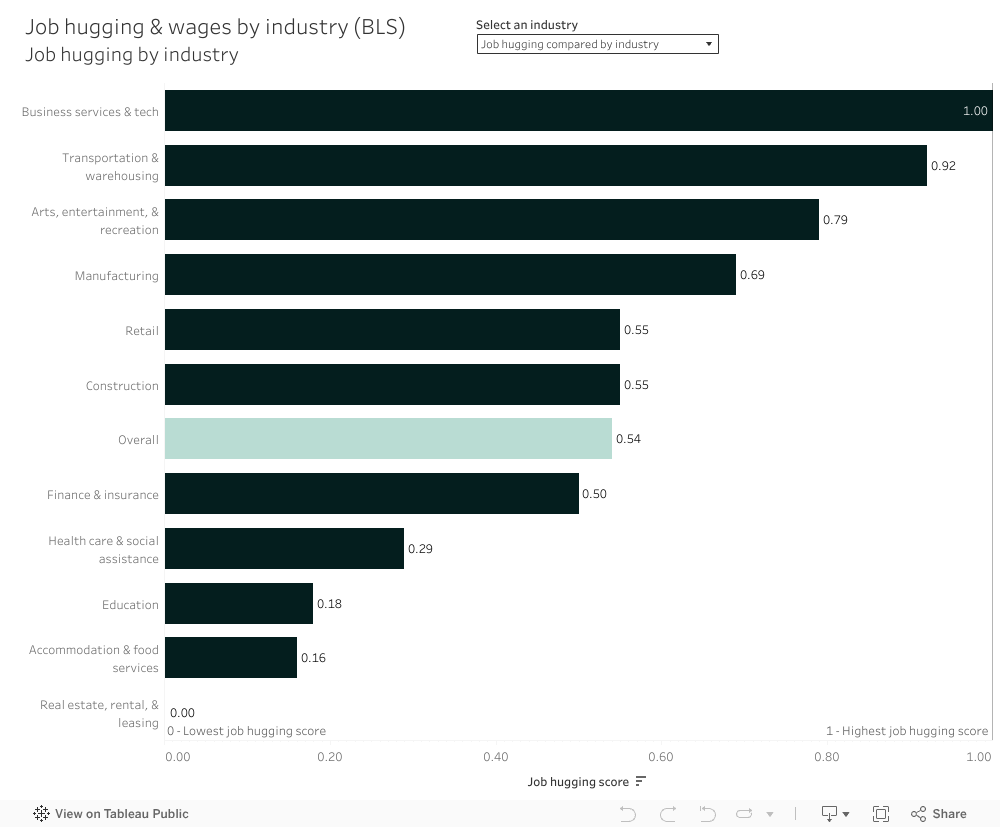
Job hugging by industry
We used data from the Bureau of Labor Statistics to analyze job hugging by industry, looking at incumbent growth coupled with quits rate. When incumbent growth is in decline, organizations aren't hiring to replace workers, so workers aren't leaving, resulting in a lower quits rate and “job hugging.”
According to the current data, we see job hugging in the labor economy overall since 2021. In 2025, incumbent growth levels are just slightly above 2010, when the United States started emerging from the Great Recession. However, there is some variation by industry and some signs of potential change heading into 2026.
We see “job hugging” as a trend for these sectors:
- Business Services & Technology
- Transportation & Warehousing
- Arts, Entertainment, & Recreation
- Manufacturing
- Construction
- Retail
However, some industries are still seeing high or increasing incumbent growth, indicating that organizations in these sectors are replacing workers despite layoffs or turnover (i.e. hiring outpaces separations). These industries include:
- Finance & Insurance
- Health Care & Social Assistance
- Real Estate, Rentals, & Leasing
Some industries are experiencing higher than average voluntary turnover despite low or declining incumbent growth. This is due to these industries having challenging conditions that result in difficulties retaining talent despite a job market that favors employers.
- Accommodation & Food Services
- Education
Special observations:
Business Services & Technology has had greatly reduced incumbent growth since the great resignation, stagnating at or below 0% with voluntary turnover dropping significantly — to below pre-pandemic levels. In 2025 specifically, Business Services & Technology is showing slight improvement in incumbent growth but is still well below the norm. Cycles of layoffs and rehiring are continuing into 2026. Some jobs are growing in demand and commanding rapid wage growth, which could be an early indicator that this sector may find its equilibrium in the future, despite advancements in AI.
Health Care & Social Assistance has seen comparatively high turnover and high incumbent growth year-over-year compared to other industries since the pandemic — by a landslide. But there has been disruption in 2025. Voluntary separations, wage growth, and incumbent growth are now all in decline for this sector. However, it still higher than other industries and above pre-pandemic levels. While a trend toward job hugging may be increasing, Health Care & Social Assistance in 2025 is an industry where both demand for labor and voluntary turnover are still relatively high.
Manufacturing has shown negative incumbent growth for three years. While 2025 is slightly less negative than 2024, voluntary turnover has dropped to lower than pre-pandemic levels.
More industry analysis is available in the full report.
The top jobs by fastest growing wages in 2025
The hottest jobs in Payscale’s End-of-Year Top Jobs Report are those where wages are growing the fastest in 2025, indicating high demand and low supply, forcing increases in compensation to attract and retain top talent.
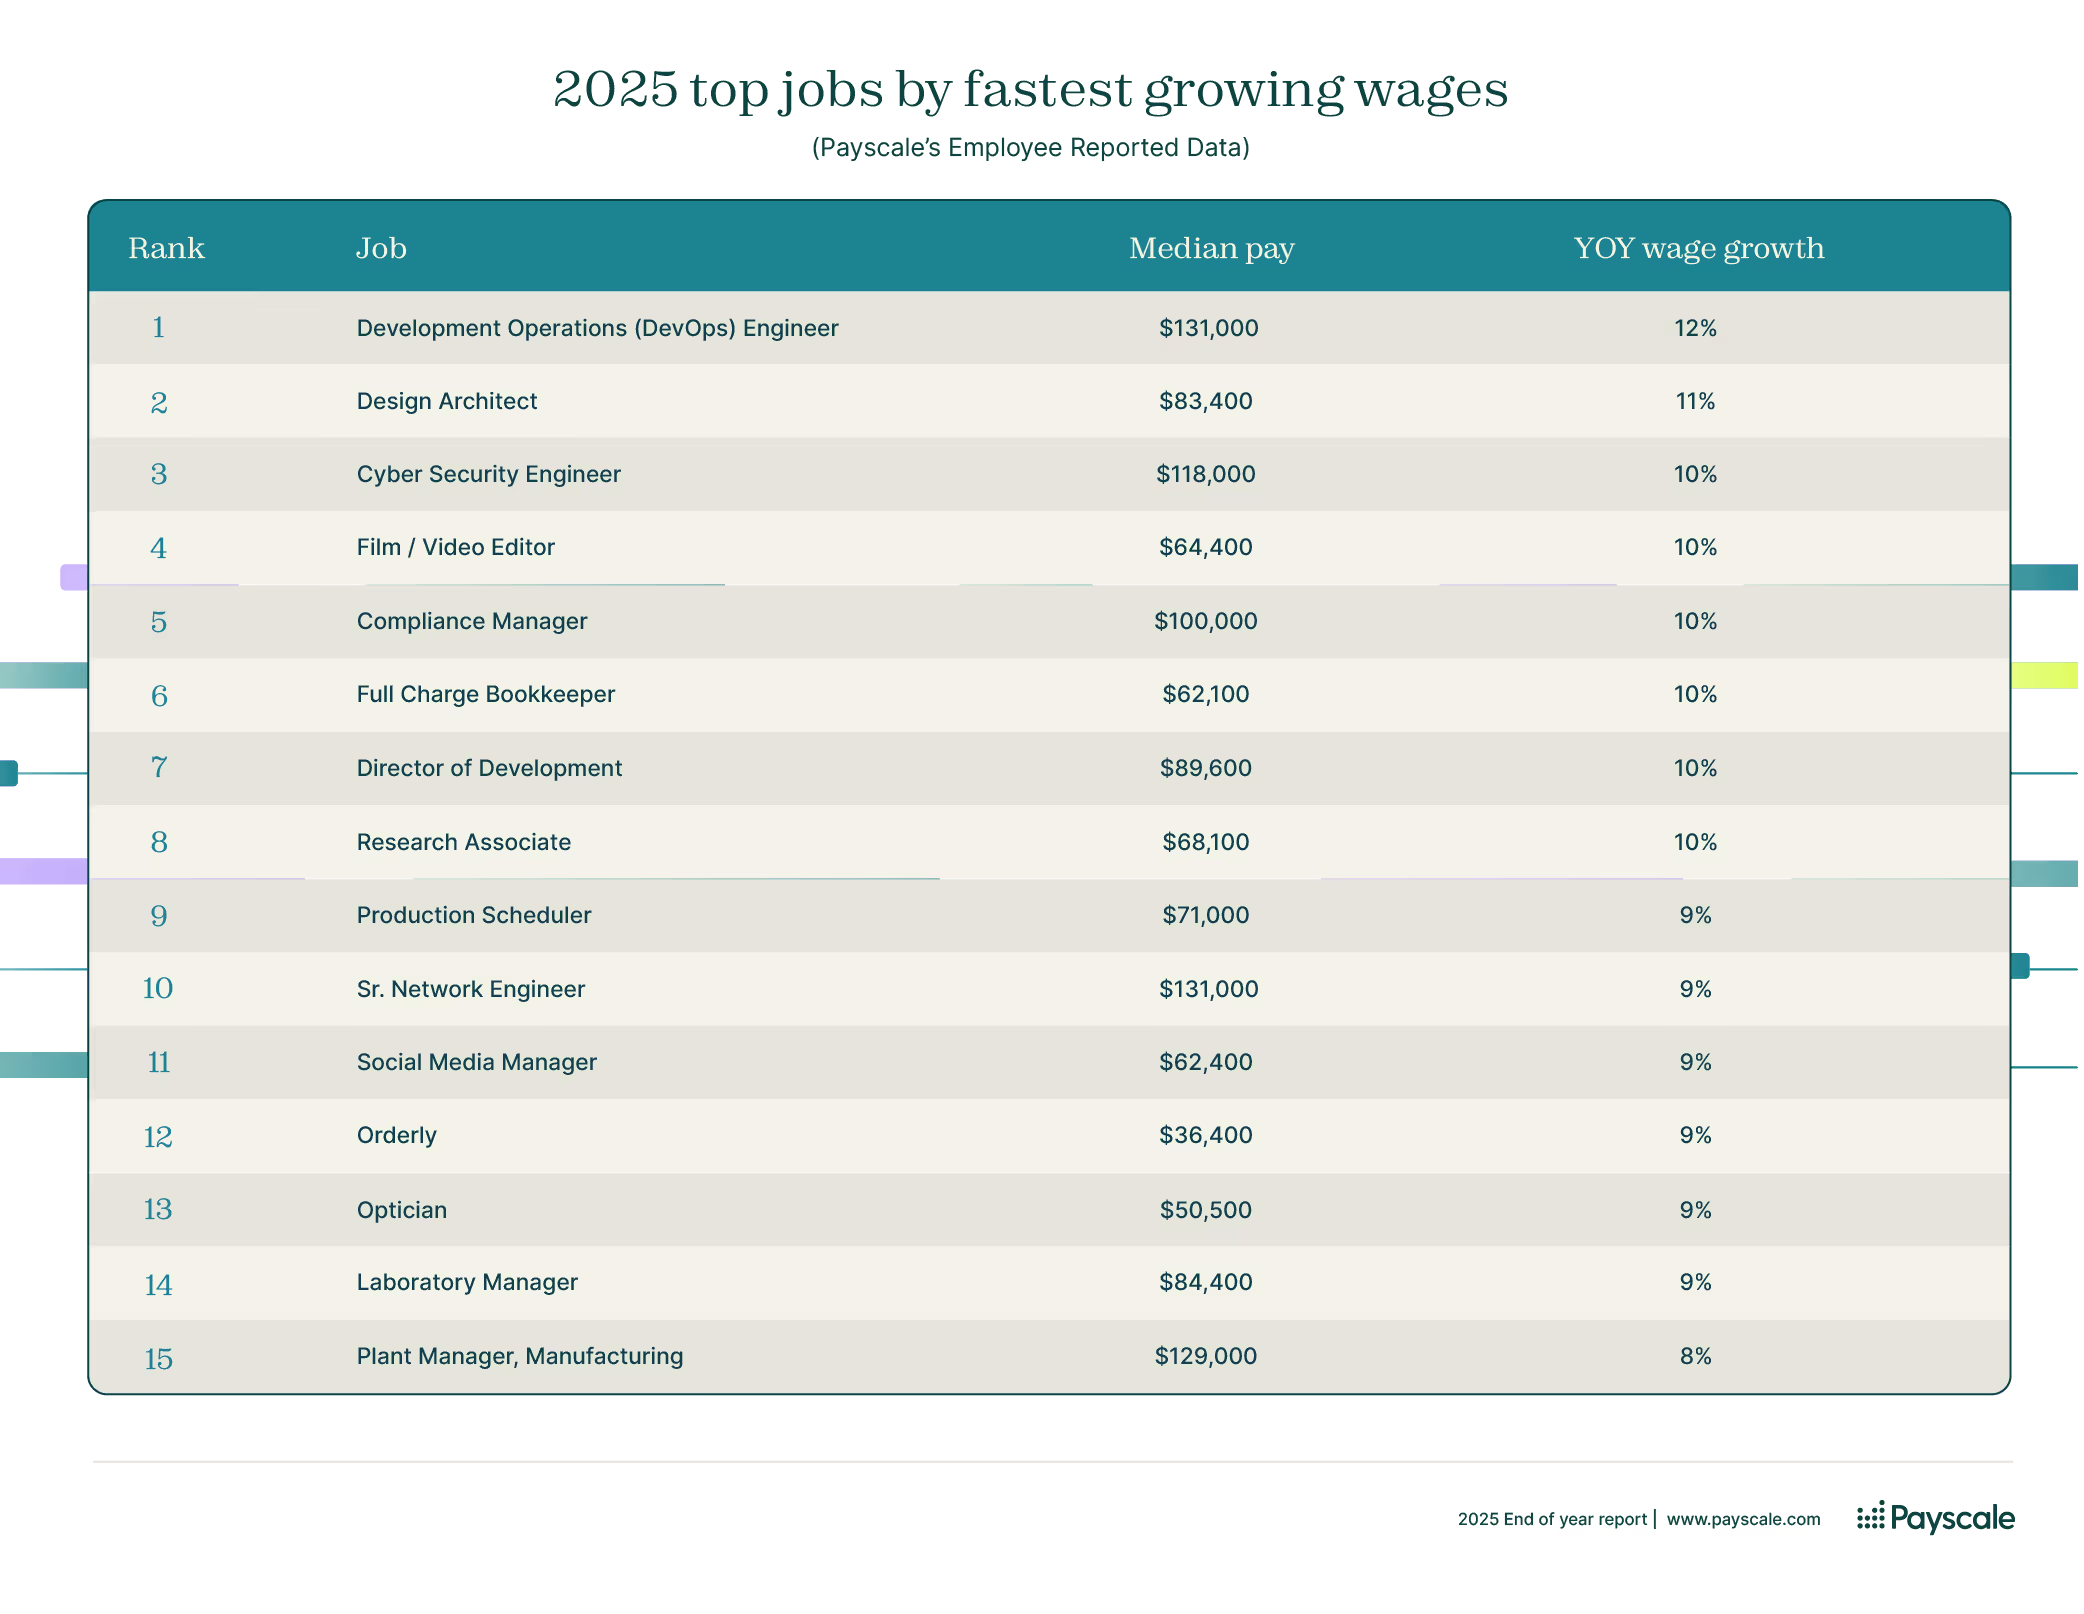
In 2025, we are seeing a resurgence of technology jobs in the top jobs list after an absence in the past few years. DevOps Engineer, Cyber Security Engineer, and Sr. Network Engineer are all IT infrastructure roles that require domain-specific knowledge and skills that are not easily automated or replaced with artificial intelligence.
Also on the list of top jobs are jobs with heavy regulation or compliance needs, such as Compliance Manager, Optician, and Laboratory Manager. There are also technically skilled operations jobs such as Plant Manager and Production Scheduler. Finally, creative roles make the list, especially creative roles that are also technical, such as Design Architect, Film/Video Editor, Social Media Manager, and Director of Development.
Collectively, these jobs reflect the intersection of technology, compliance, and production — areas that are still expanding despite economic cooling elsewhere. These jobs support digital transformation, data security, and operational efficiency, which have been priorities over the past year.
The jobs people are most seeking to quit in 2025
Payscale’s online salary survey collects salary data from job seekers who are evaluating a new offer. From this information, we provide a ranked list of jobs that people are most seeking to quit, even if it is for a similar job in another organization. Often, pay and quits rates are correlated, as pay increases failing to keep up with the market is a strong instigator for seeking a new job.
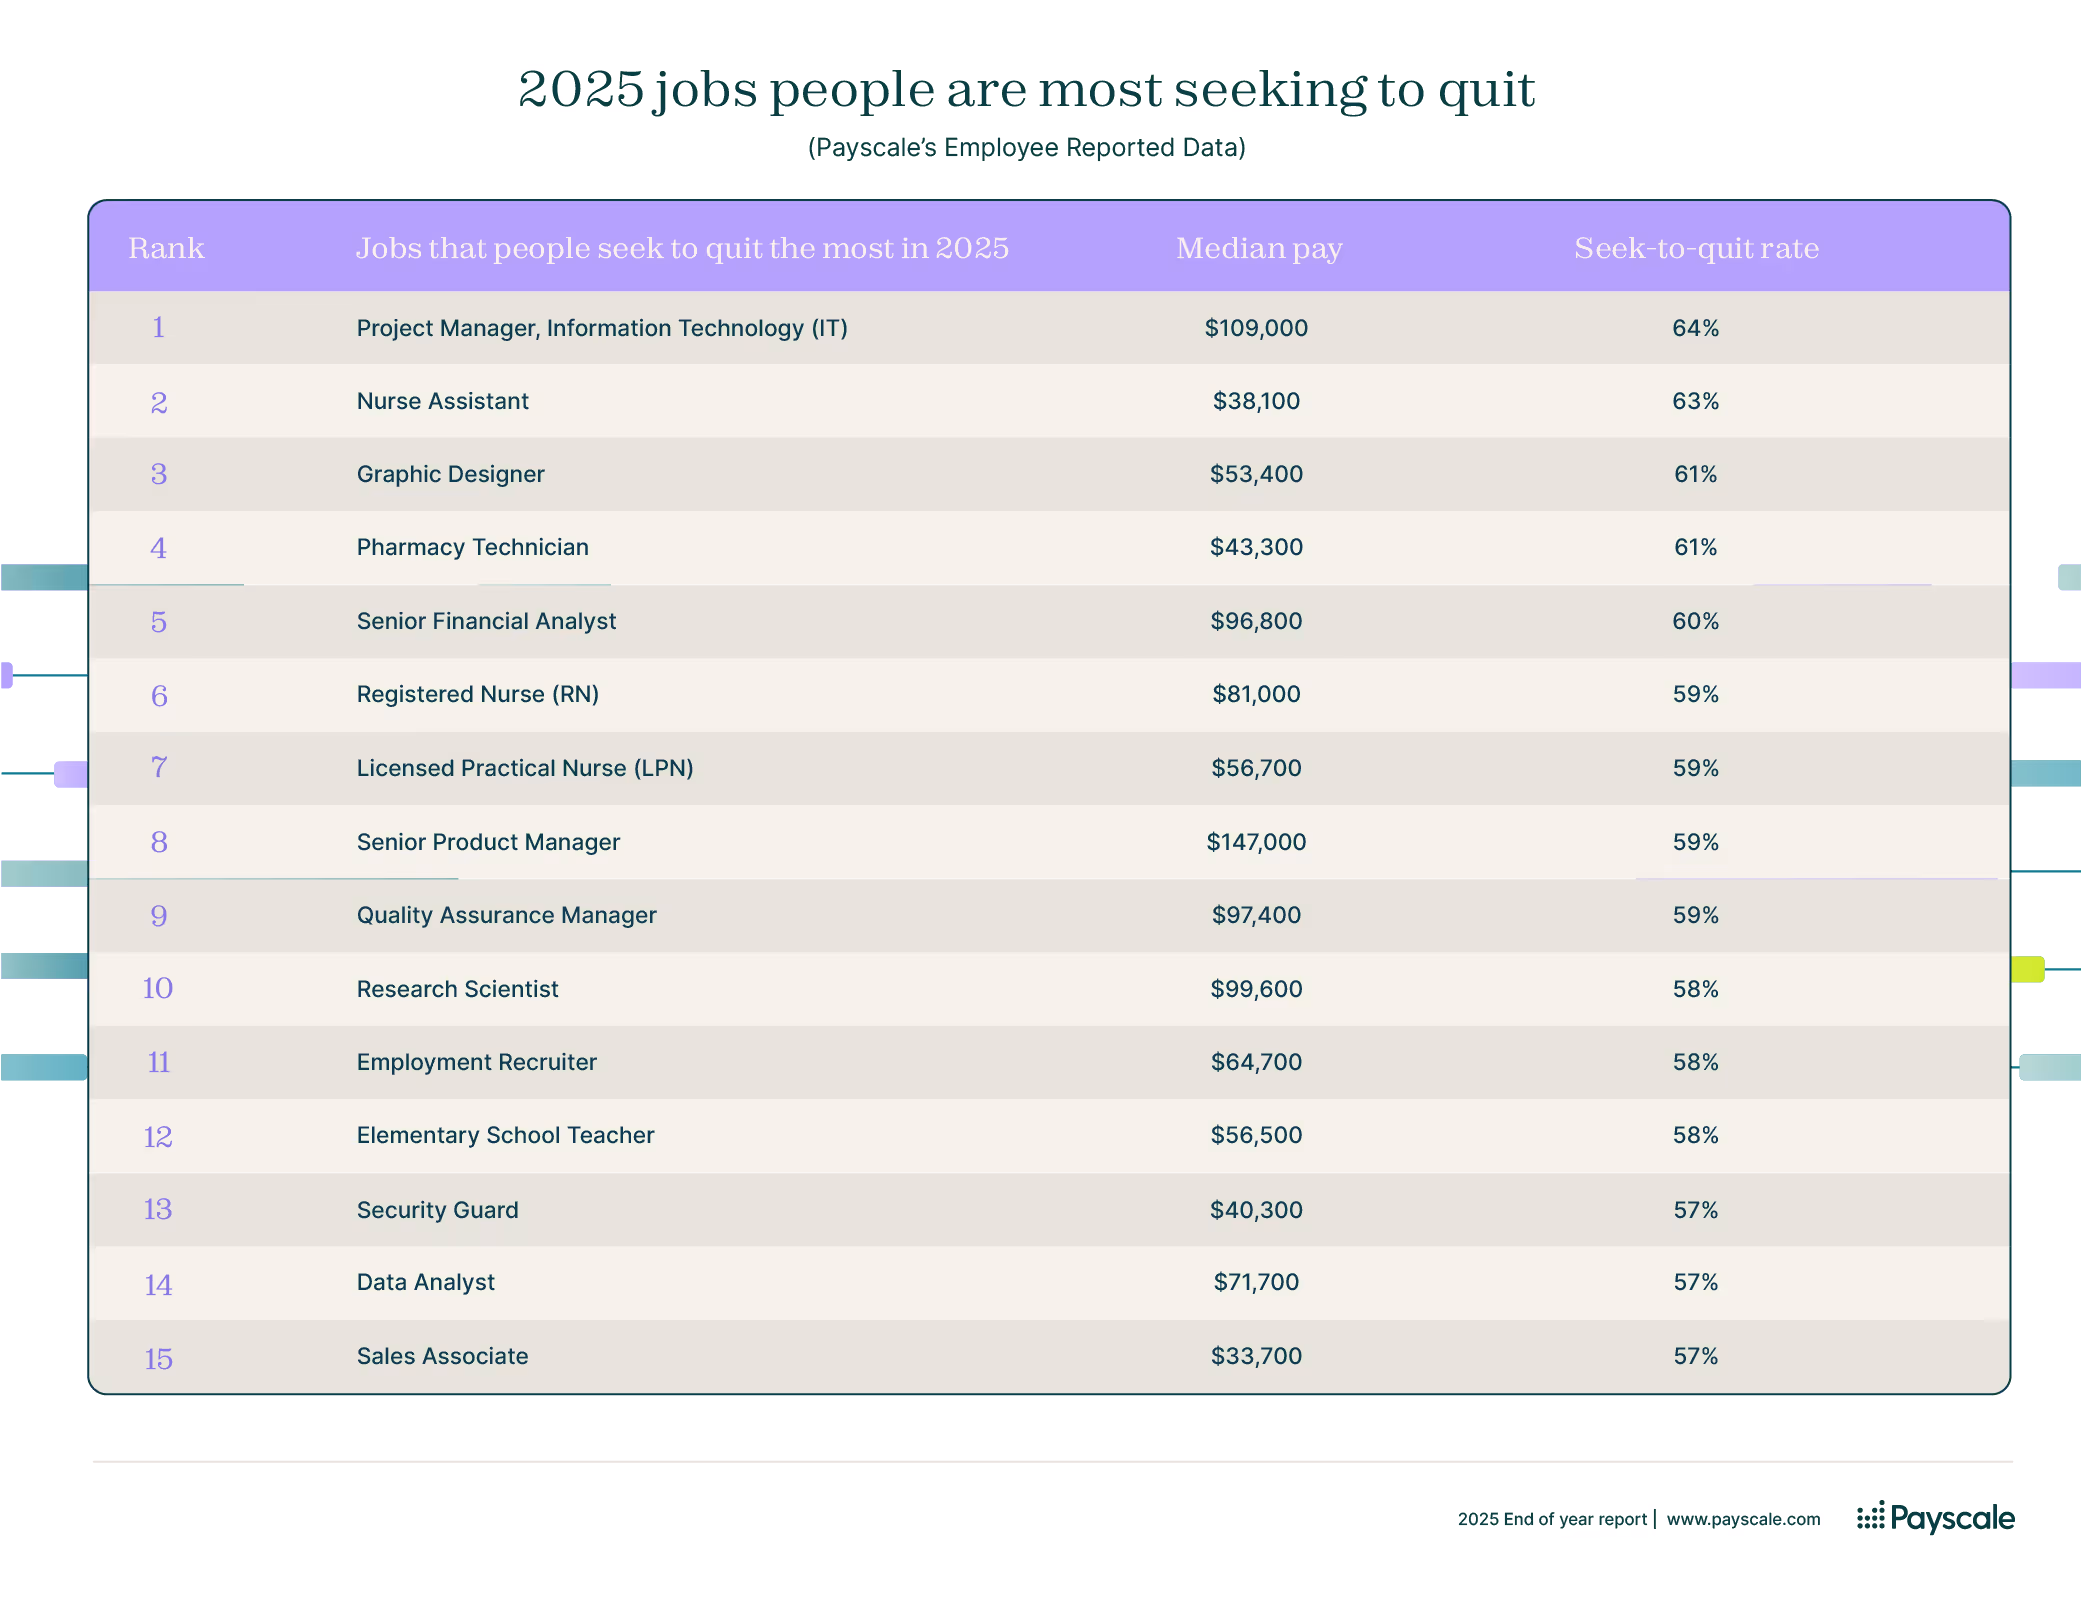
In 2025, the jobs with the highest “seeking to quit” rates reflect a mix of burnout, job stress, stagnant advancement opportunities, and shifting expectations. Dissatisfaction with wage growth, workload, flexibility, workplace toxicity, and job meaning pushes employees to make career changes.
On the list this year are white-collar technical positions, such as IT Project Managers, Product Managers, and Data Analysts. In 2025, many organizations have tightened budgets while maintaining ambitious performance expectations for tech employees, who are being asked to deliver more with smaller teams. IT and data professionals face project overload and constant technological change without corresponding support or flexibility. As a result, many are seeking either independent consulting roles, remote work arrangements, or entirely new careers that offer better work-life balance.
In healthcare and education, the story is dominated by chronic burnout and emotional fatigue. Roles such as Nurse Assistants, Registered Nurses, Licensed Practical Nurses, and Elementary School Teachers continue to experience high quit rates because of understaffing, demanding hours, and limited institutional support. These professions face stagnant real wages compared to stress levels. The lingering aftereffects of the pandemic, heavier workloads, budget restrictions, and mortal injury have made these fields emotionally taxing in 2025.
For service, creative, and entry-level roles — including Graphic Designers, Pharmacy Technicians, Sales Associates, and Security Guards — turnover is driven more by low pay, limited advancement, and competition for flexible or remote work opportunities. Workers in these fields increasingly view their jobs as transitional, especially as gig work, freelancing, and hybrid employment models expand in a volatile economy.
Perhaps unsurprisingly, Employment Recruiter also ranks among the jobs with the highest quit rates in 2025. Recruiting has become increasingly stressful. There is a high emotional toll in working with job candidates as opportunity becomes scarcer and job seekers become more desperate. Managing rejections, mismatched expectations, and constant pressure to meet hiring targets leaves many recruiters feeling burned out. Recruiting is also more unstable than it used to be, with changing economic conditions, misinformation related to AI technology, and operational changes (ghost jobs, resume collecting, picky hiring processes) contributing to misaligned expectations and frustration.
Overall, the pattern across all the jobs people are most seeking to quit reflects a labor market where workers are loathe to leave their jobs but are more willing to seek new opportunities when their jobs fail to deliver balance, stability, growth opportunity, or purpose, even when “job hugging” is becoming a trend. While wage levels differ widely, a common thread is a mismatch between effort, stress, and perceived reward.
The top hard-to-fill jobs in 2025
In the world of recruiting, hard-to-fill jobs are positions that employers struggle to hire because there aren’t enough qualified candidates, the skills required are highly specialized, or the job’s conditions make it unattractive to potential workers. These roles often stay open far longer than average despite competitive pay.
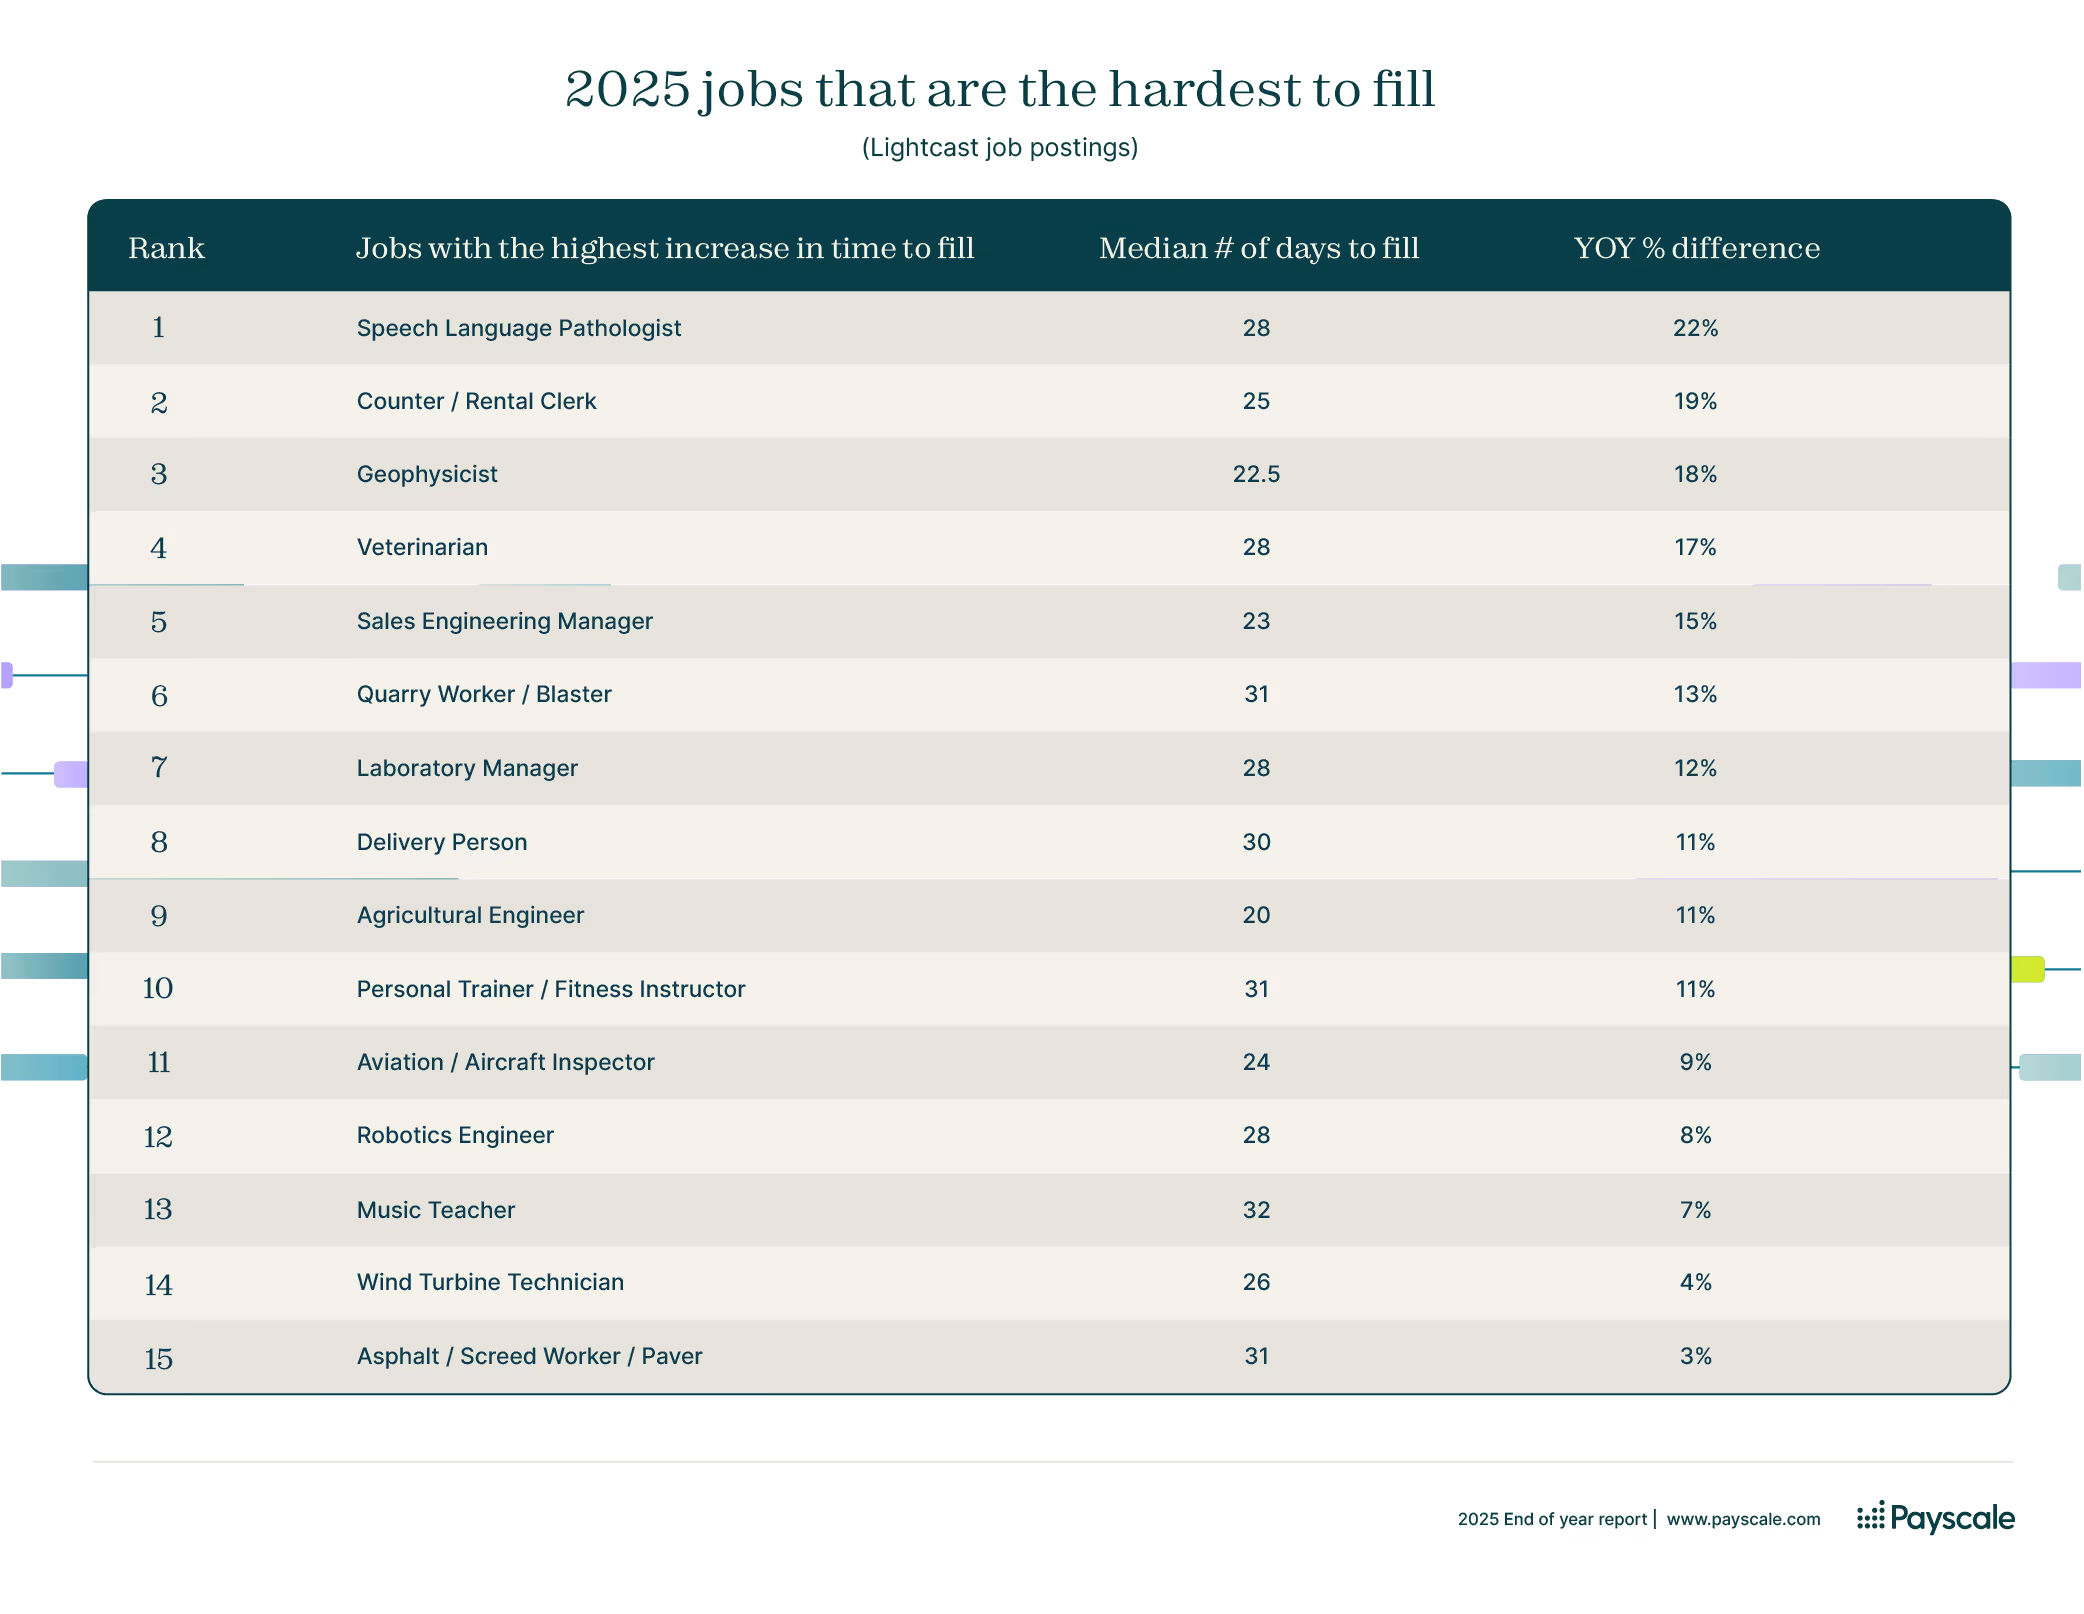
In 2025, the hardest-to-fill jobs primarily fall into two categories: those requiring specialized education and licensing and those demanding hands-on technical expertise.
Roles like Speech Language Pathologist, Veterinarian, Laboratory Manager, and Music Teacher require advanced degrees, state certifications, understanding of regulations, and practical experience that take years to obtain. These professions are facing workforce shortages because education pipelines haven’t kept pace with retirements or demand growth. For example, the demand for Speech Language Pathologists and Veterinarians has surged due to aging populations and increased pet ownership, while burnout and high educational costs deter new entrants. Similarly, Laboratory Managers and Music Teachers often face funding and staffing constraints that make the jobs demanding but not highly compensated, leading to chronic vacancies. Laboratory Managers are also one of the top jobs by wage growth.
Another cluster of hard-to-fill roles is defined by physical demands. Jobs like Quarry Worker/Blaster, Asphalt or Screed Worker, and Wind Turbine Technician involve hazardous or outdoor work environments, long hours, and remote locations. Despite offering decent pay, these roles struggle to attract workers because of danger, physical strain, and limited flexibility.
Meanwhile, Aviation and Aircraft Inspectors face shortages because the position requires FAA certification, years of mechanical experience, and an uncompromising adherence to safety standards. These are factors that narrow the candidate pool dramatically, especially in a year when airlines are under increased strain due to recent news about failing quality assurance, such as the recent $3.1 million fine against Boeing for safety violations. Similarly, Agricultural Engineers and Sales Engineering Managers are hard to fill because these jobs blend technical mastery with problem-solving skills in industries facing talent scarcity.
There are also jobs on this list that have a lower barrier to entry but also poor job security, lower pay, limited career growth, and stress dealing with customers, such as Delivery Drivers and Counter/Rental Clerks. Meanwhile, Personal Trainers contend with inconsistent income and the growing competition of digital fitness platforms.
The common theme across all these positions in 2025 is a mismatch between job requirements and the available workforce due to training gaps and shifting expectations for workplace flexibility, safety, stability, and work-life balance.
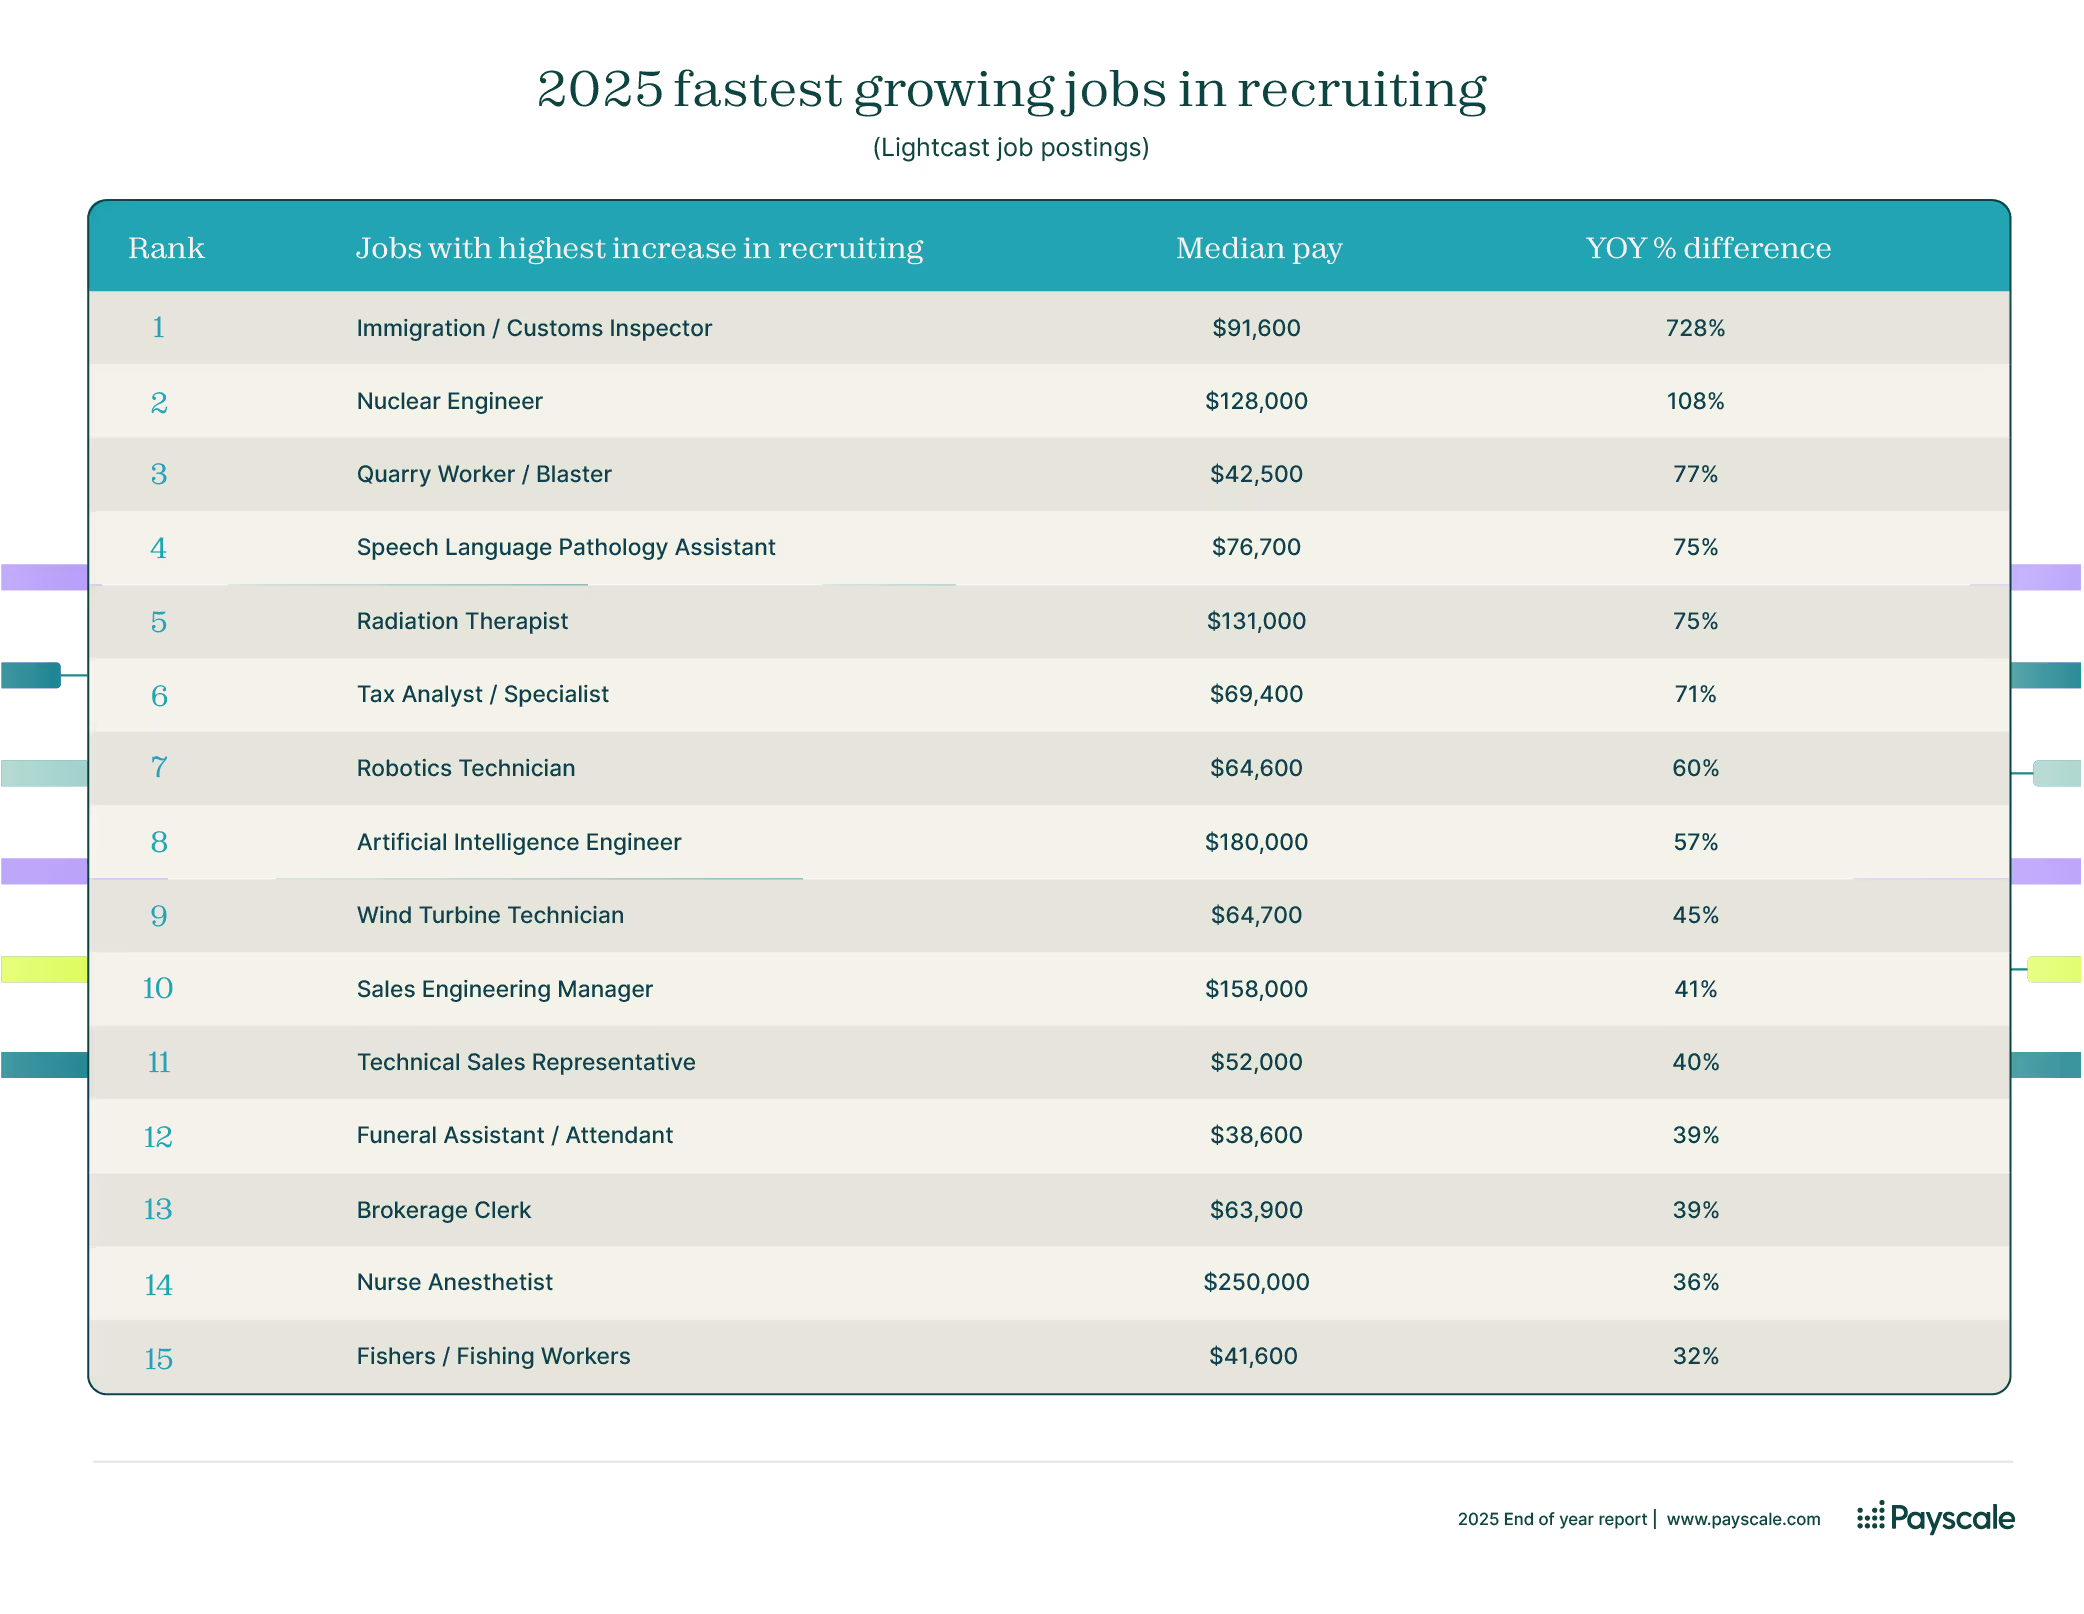
The top jobs in recruiting in 2025
Top jobs are also those with the greatest increase in demand over the course of the year. In 2025, the job that tops the list is Immigration/Customs Inspector. Federal agencies have ramped up enforcement and border-related staffing in 2025. The U.S. Immigration and Customs Enforcement (ICE) made over 1,000 tentative job offers in just one period following major budget authorizations for border work. The Department of Homeland Security has also ramped up hiring.
Other roles reflect specialized technical skill shortages. Some of the highest paid positions on the list include Nuclear Engineer, Radiation Therapist, Artificial Intelligence Engineer, Sales Engineering Manager, and Nurse Anesthetist. Each of these roles demands significant technical or clinical expertise requiring advanced education and deep specialized knowledge. These roles also operate at greater major risk/complexity where the cost of errors or business/health impact is high — so employers are willing to pay more. Collectively, the combination of required credentials, complex technologies, and regulatory constraints makes these roles harder to fill.
Also on the list are lower wage positions that do not require as much formal education, such as Quarry Worker/Blaster, Counter/Rental Clerk, Technical Sales Representative, Funeral Assistant/Attendant, Fishers/Fishing Workers, and Brokerage Clerk. However, these jobs often involve physically or emotionally demanding work, with some requiring irregular hours and sensitivity to local economic conditions or seasonal demand, contributing to variability in job security and employment growth.
The top jobs in special sectors in 2025
Lightcast also provides additional job analysis for a list of special sectors that are not easily quantifiable using traditional occupations or industry hierarchies. These sectors are developed by Lightcast economists and researchers in collaboration with industry experts. The sectors are Artificial Intelligence, Data Privacy and Protection, Cybersecurity, and Green Jobs.
The top jobs in special sectors by job posting growth reflect rapid technological adoption, regulatory complexity, and societal shifts driving demand for specialized skills.
- In Artificial Intelligence, roles like Software Developer, AI Engineer, Data Scientist, and Product Manager dominate postings because companies are integrating AI into products, operations, and analytics at scale.
- In Data Privacy/Protection, positions such as Database Architect, Software Engineer, and Data Engineer are critical as organizations comply with stricter privacy regulations and manage expanding data assets.
- In Cybersecurity, positions are ramping up for specialties like Information Security Engineers and Defense Security Analysts due to escalating cyber threats and the need to secure complex digital infrastructures.
- In Green Jobs, there are increased job postings for Environmental Planners, Solar Installers, and Wind Turbine Technicians because the transition to renewable energy, sustainability initiatives, and environmental compliance is accelerating, creating both skilled and semi-skilled opportunities.
.avif)
Methodology
Payscale provides a list of hot jobs which have seen the highest growth in wages and quits rates from our employee-reported online salary survey data from 2024 to 2025.

Payscale analyzed 618,271 respondents that completed a salary profile between 11/1/2024 and 10/31/2025 by U.S. workers to rank the prevailing 2025 hot jobs list. The final list of rankings represents 4,416 respondents across 15 job titles. We also provide a top list of jobs with the highest quit rates, which leveraged respondents who answered the following research question:
"In the next 6 months, I plan on actively seeking new jobs outside of my current company: Yes / No"
BLS Labor Turnover: Data sourced from the Bureau of Labor Statistics Job Openings and Labor Turnover (JOLT) Survey, August 2025 release.
To determine rankings in recruiting trends, Payscale leverages job postings data sourced from Lightcast, a global leader in labor market analytics.
- Total Cash Compensation (TCC): TCC combines base annual salary or hourly wage, bonuses, profit sharing, tips, commissions, and other forms of cash earnings, as applicable. It does not include equity (stock) compensation, cash value of retirement benefits, or value of other non-cash benefits (e.g., healthcare).
- Median Pay: The median pay is the national median (50th percentile) annual total cash compensation. Half the people doing the job earn more than the median, while half earn less.
- YOY Wage Growth: The percent increase in median pay for a given job title, collected from Payscale's employee reported online salary survey.
- Seek to Quit Rate: The percentage of respondents in a given job title who intend to seek a new job in the next 6 months, collected from Payscale's employee reported online salary survey.
- Annual net incumbent growth: The annual percentage difference between hires and separations. Negative values indicate employers are not replacing workers due to layoffs or turnover. Positive values indicate hires exceed separations, indicating net growth in the employee population.
- Job hugging score: This is a proxy figure derived from BLS JOLTs data to compare job hugging behavior across industries. To arrive at this score, we calculated the median annual net incumbent growth and median % of separations that are quits. We subtract these median values from their respective annual value for a given year and industry. Added together, these create an indicator value of which industries have the least amount of incumbent growth and voluntary turnover combined. We then adapt these figures to a linear scale from 0 to 1 for ranking.
- Nominal Wage Growth: Wage growth not adjusted for inflation.
- Real Wage Growth: Wage growth adjusted for inflation, using the Consumer Price Index (CPI) from the Bureau of Labor Statistics.
- Net Incumbent Growth: The percent difference between hires and separations. Positive value indicates hires outpace separations, while negative value indicates separations outpace hires.
- % of separations: voluntary - The percentage of separations due to voluntary turnover.
- Hire Rate - The percentage of newly hired employees among the employed workforce. [BLS JOLTS Data]
- Job Openings Rate - The percentage of job openings among all filled and unfilled positions. [BLS JOLTS Data]
- Quits Rate - The percentage of employees that voluntarily left their job among the employed workforce. [BLS JOLTS Data]
- Layoffs Rate - The percentage of employees that were laid off among the employed workforce. [BLS JOLTS Data]
Payscale is the original compensation innovator for organizations who want to scale their business with pay and transform their largest investment into their greatest advantage. With decades of innovation in sourcing reputable data and developing AI-powered tools, Payscale delivers actionable insights that turn pay from a cost to a catalyst. Its suite of solutions — Payfactors, Marketpay, and Paycycle — empower 65% of the top companies in the U.S. and businesses like Panasonic, ZoomInfo, Chipotle, Quest Diagnostics, University of Washington, American Airlines, and TJX Companies.
Create confidence in your compensation. Payscale.
To learn more, visit www.payscale.com.
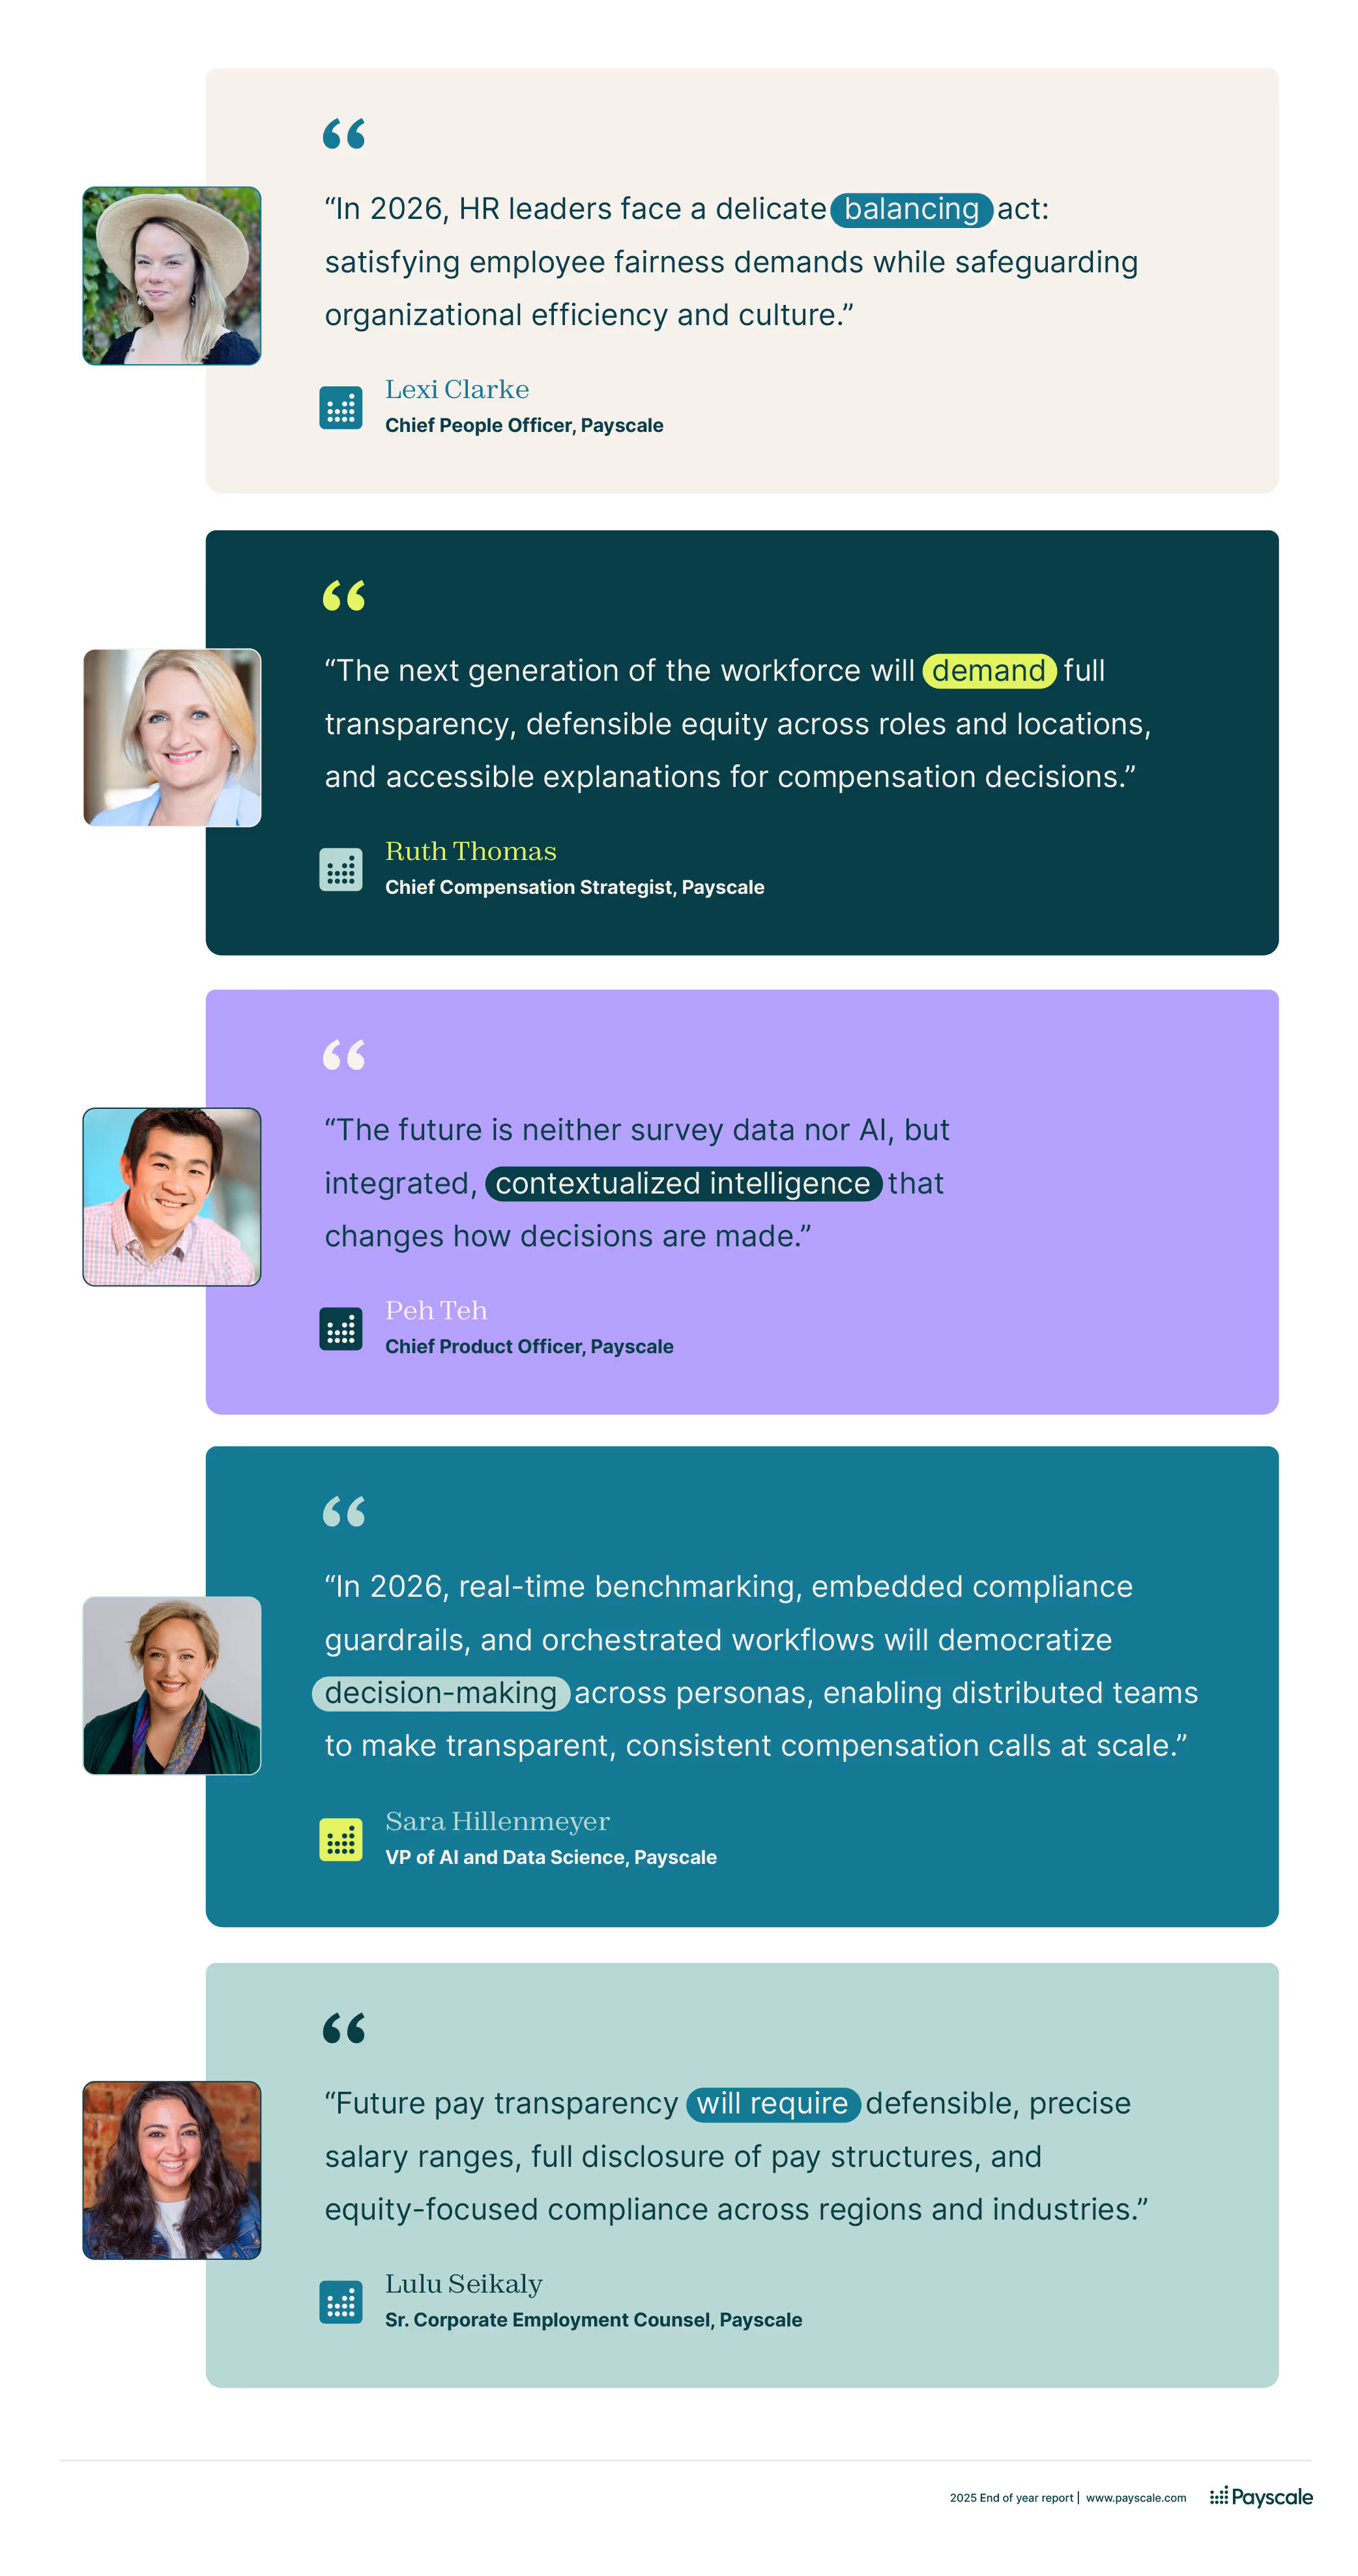
2026 compensation predictions
In the full report, leaders from Payscale provide predictions for the upcoming year at the intersection of human resources, compensation strategy, technology, data/artificial intelligence, and regulatory compliance.
Download the Full Report
HR leaders and compensation professionals are encouraged to download a copy of Payscale’s End-of-Year Top Jobs Report, which comes with a fuller explanation of 2026 predictions related to compensation and a round-up of Payscale research and insights from 2025.

Clear, confident pay decisions await
Experience Payscale for yourself.