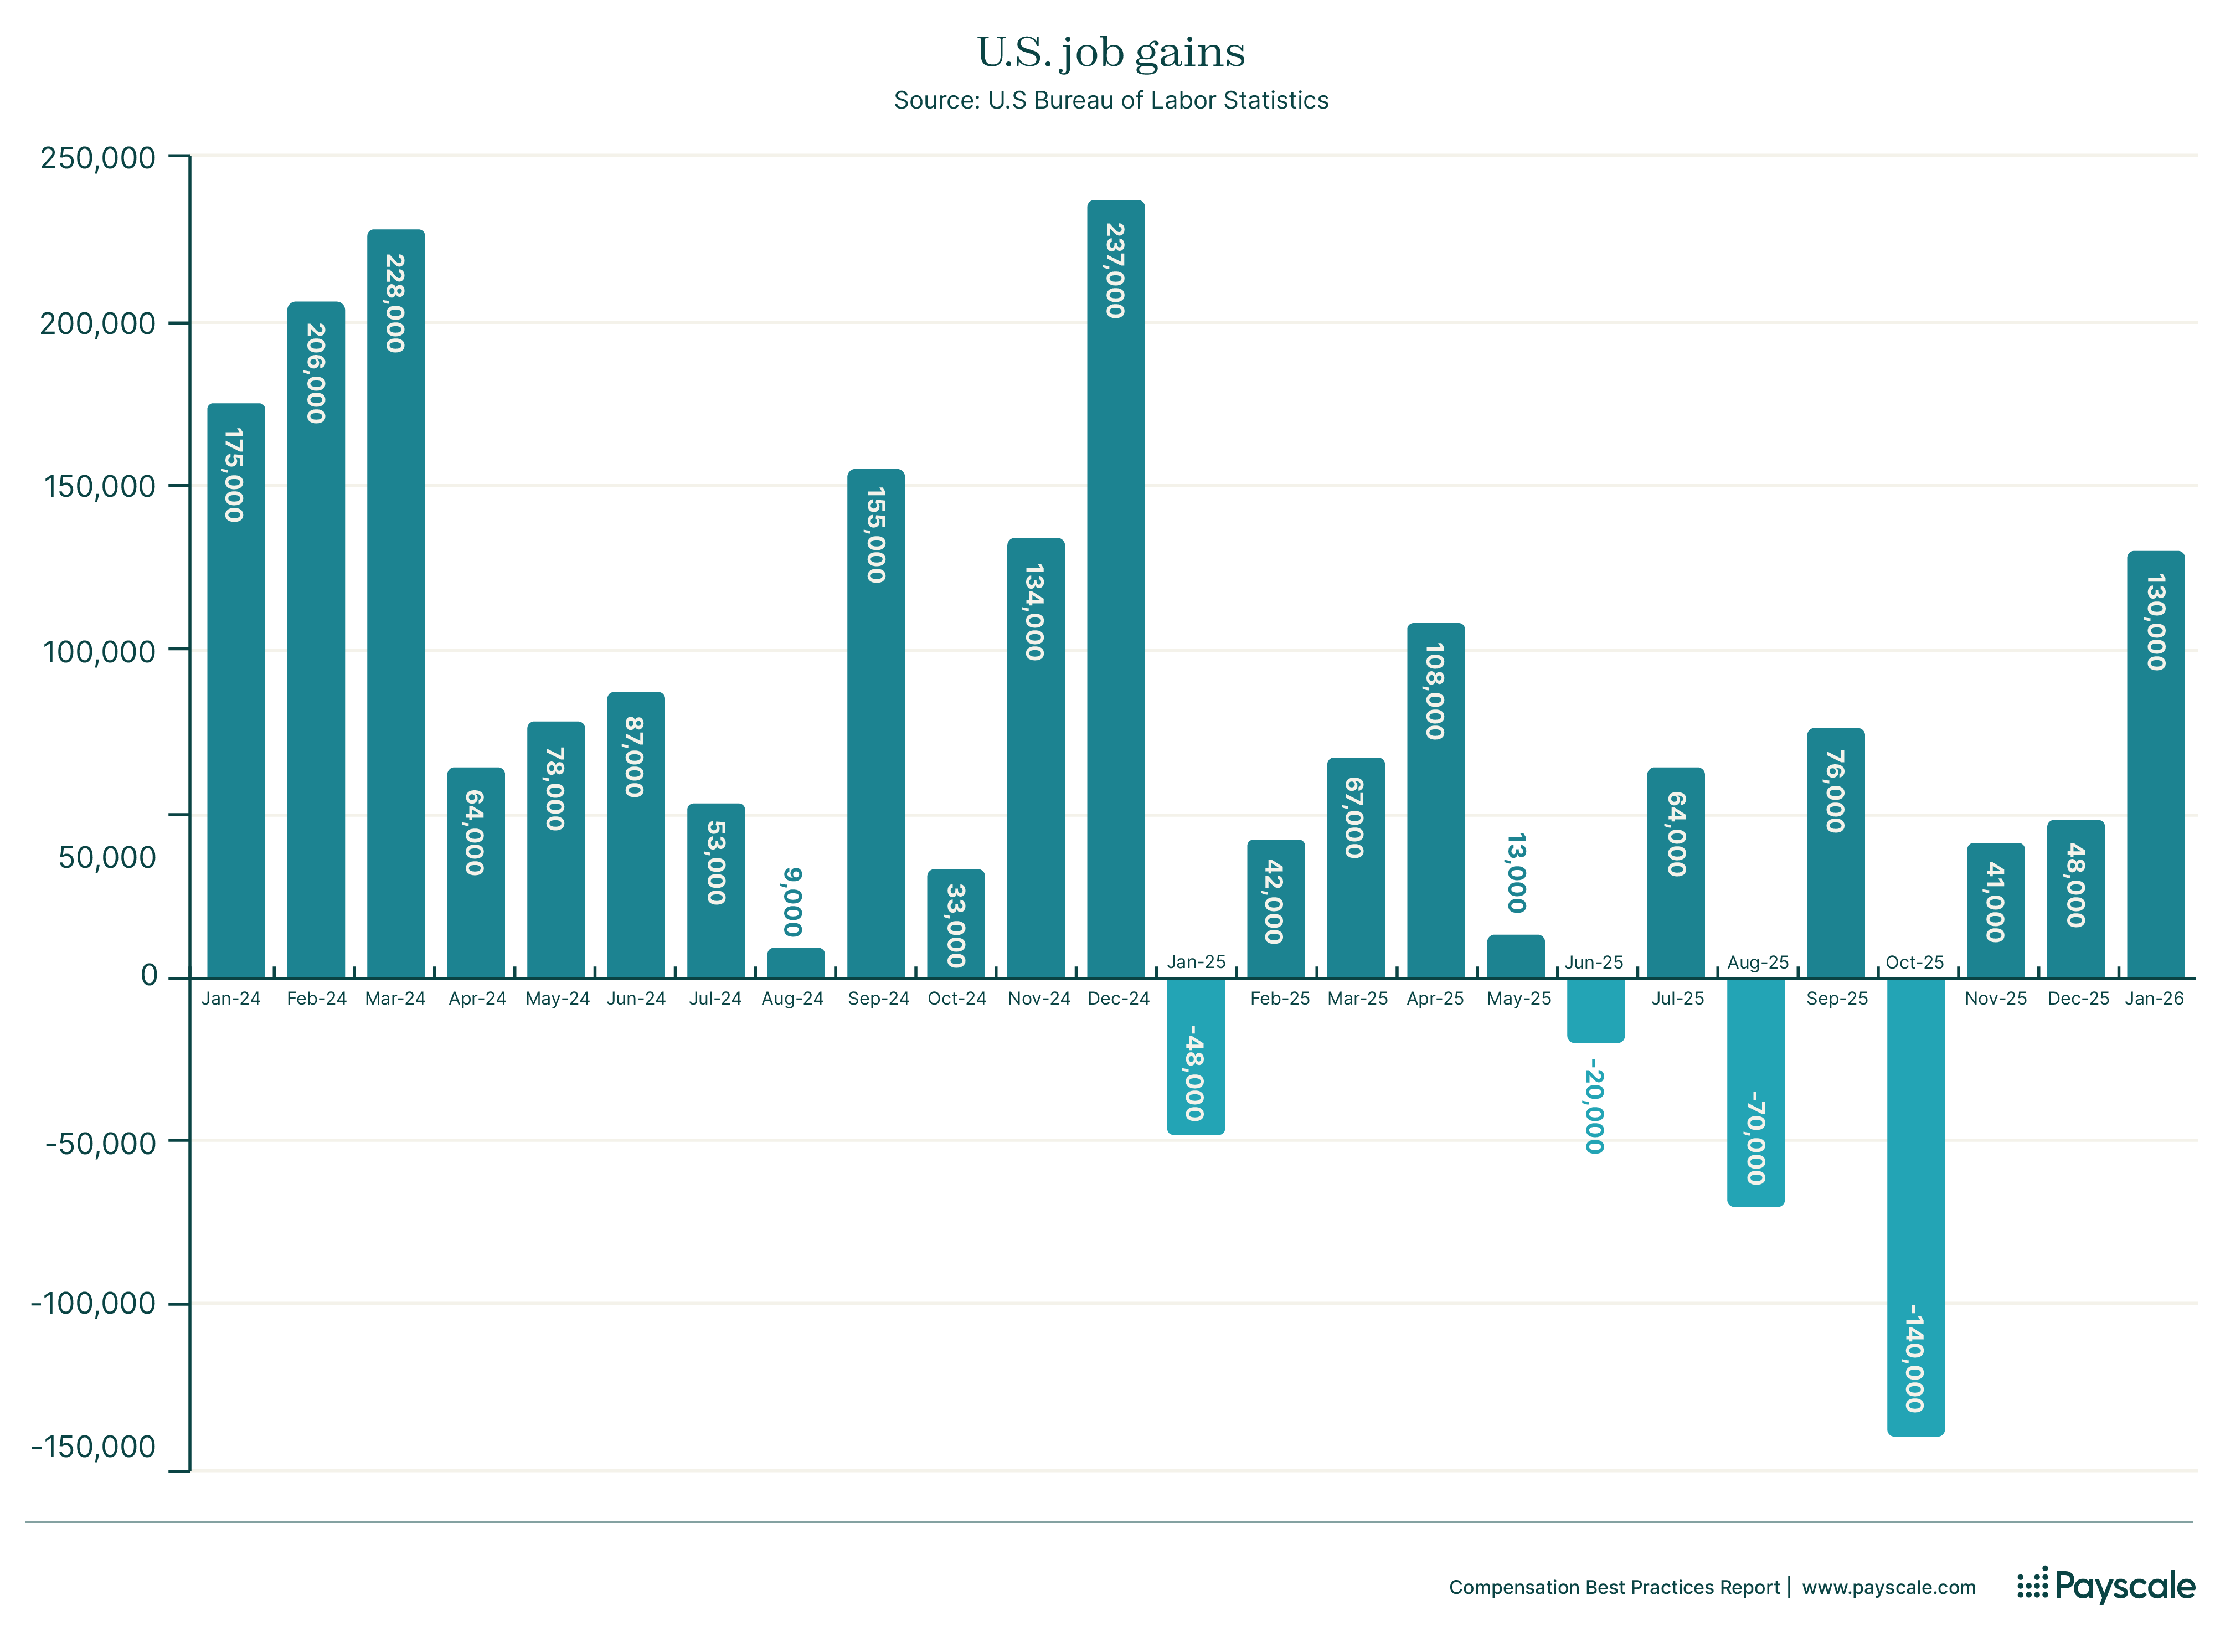
State of the labor market
At the end of 2024, the economy improved and the Federal Reserve announced that a recession had been avoided. The U.S. economy was on the upswing. However, in 2025, economic growth stymied and job gains plummeted in the second half of the year.
According to Payscale’s Compensation Best Practices Report, business performance also declined slightly in 2025, with 24% of organizations saying they would exceed revenue goals compared to the previous year (-1% YOY).

According to the Compensation Best Practices Report, total turnover was 12% and voluntary turnover was 8%, which is historically low. Hiring was also relatively low, as evidenced by job gains, with only 43% of organizations saying they hired actively across departments.

Despite a labor market that favors employers, most organizations are not taking advantage by lowering pay, with the most common reaction being to reduce pay increases (16% of organizations). However, employees believe pay to be unfair. When it comes to unfair pay perceptions, 40% of organizations cite misinformation or disinformation from unverified data sources.
.png)
Spotlight on artificial intelligence
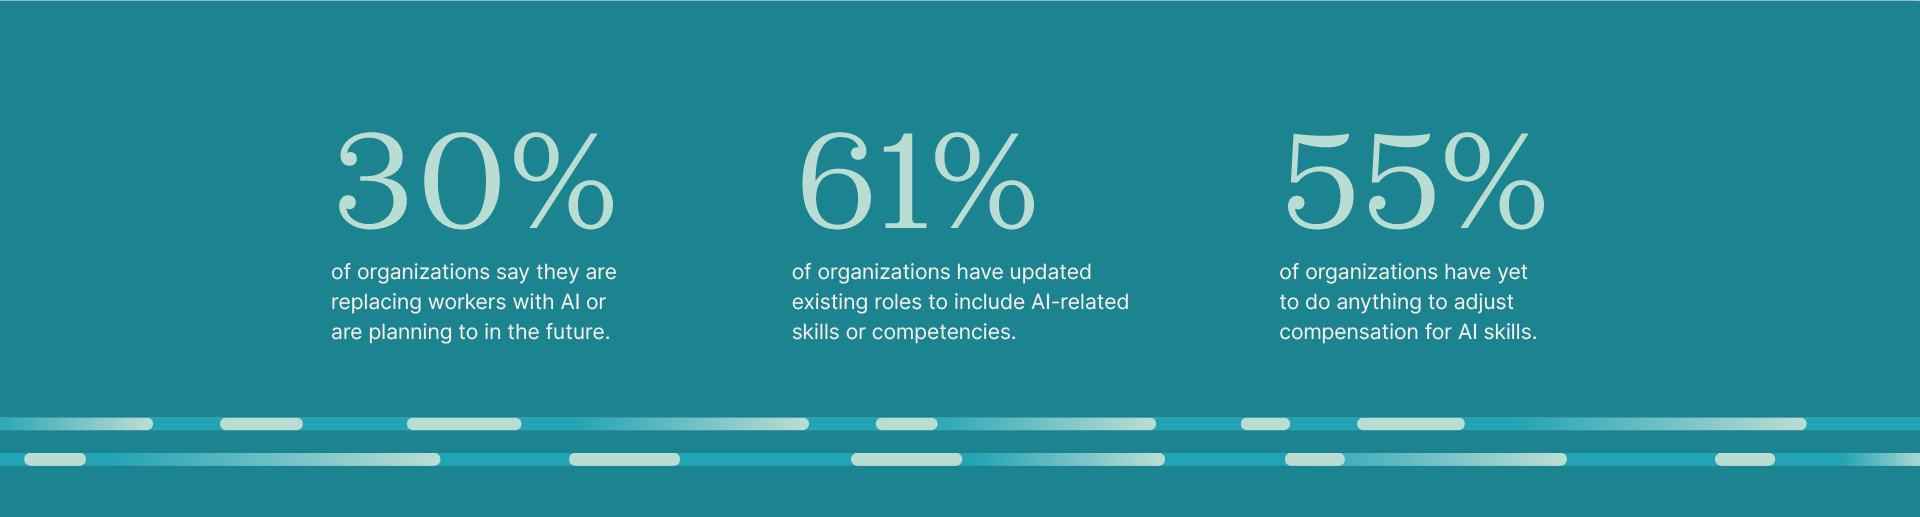
According to Payscale’s Compensation Best Practices Report, 30% of organizations say they are replacing workers with AI or planning to in the future. In addition, 61% of organizations have updated existing roles to include AI-related skills or competencies, but 55% have yet to do anything to adjust compensation for AI skills.
Artificial intelligence is also reshaping compensation management by enabling faster, more data-driven and scalable pay decisions. However, according to the Compensation Best Practices Report, 57% of organizations cite transparency and accuracy of outputs as essential in earning trust, with 21% of organizations trusting only compensation-specific AI tools that have methodologies and controls.
.png)
Compensation preparedness and maturity
In 2026, compensation management is being reshaped by multiple forces converging simultaneously:
- A cooling labor market
- Shrinking budgets
- The accelerating impact of AI
- A concerted push to center outcomes
As payroll is a significant expense for most organizations, there is an increasing need for compensation intelligence that can deliver insights on-demand and at scale so that pay decisions are competitive and defensible.
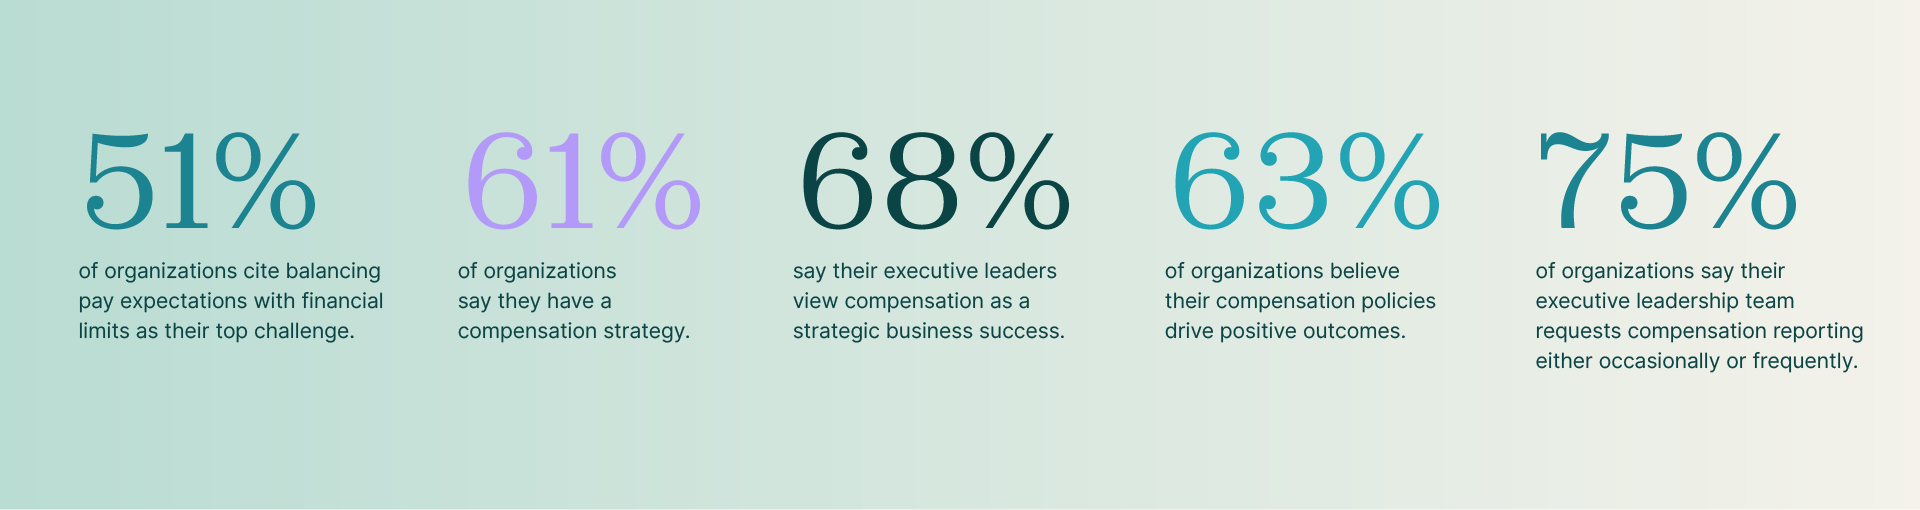
In the 2026 Compensation Best Practices Report, we find that 51% of organizations cite balancing pay expectations with financial limits as their top challenge. Fortunately, 61% of organizations say they have a compensation strategy and 68% say their executive leaders view compensation as a strategic business success.
In addition, 63% of organizations believe their compensation policies drive positive outcomes and 75% of organizations say their executive leadership team requests compensation reporting either occasionally or frequently.
We also found that compensation maturity grew 12% in 2026 according to Payscale’s Compensation Maturity Model. As was true last year, compensation maturity is associated with purpose-built compensation management point solutions like Payscale.
.avif)
Pay transparency and pay equity
Pay transparency legislation continues to expand worldwide and 2026 is the year that the EU Pay Transparency Directive takes effect, making this an especially critical year for pay transparency and pay equity.
According to Payscale’s Compensation Best Practices Report, 57% of organizations say they post salary ranges in job ads, 42% do it across all jobs regardless of location or requirements, but only 23% are fully prepared for the EU Pay Transparency Directive.
Our report also finds that 60% of organizations say that pay equity analysis is a current or planned initiative, a 3% increase YOY. For the minority that did not, only 10% cited de-prioritization of DEI as a reason.
Even more exciting, we see that almost half of organizations (49%) are targeting pay transparency either across the organization or publicly in 2026, which is a 16% jump from last year when it was only a third of organizations.
We also found that compensation maturity grew 12% in 2026 according to Payscale’s Compensation Maturity Model. As was true last year, compensation maturity is associated with purpose-built compensation management point solutions like Payscale.
Salary data and market pricing
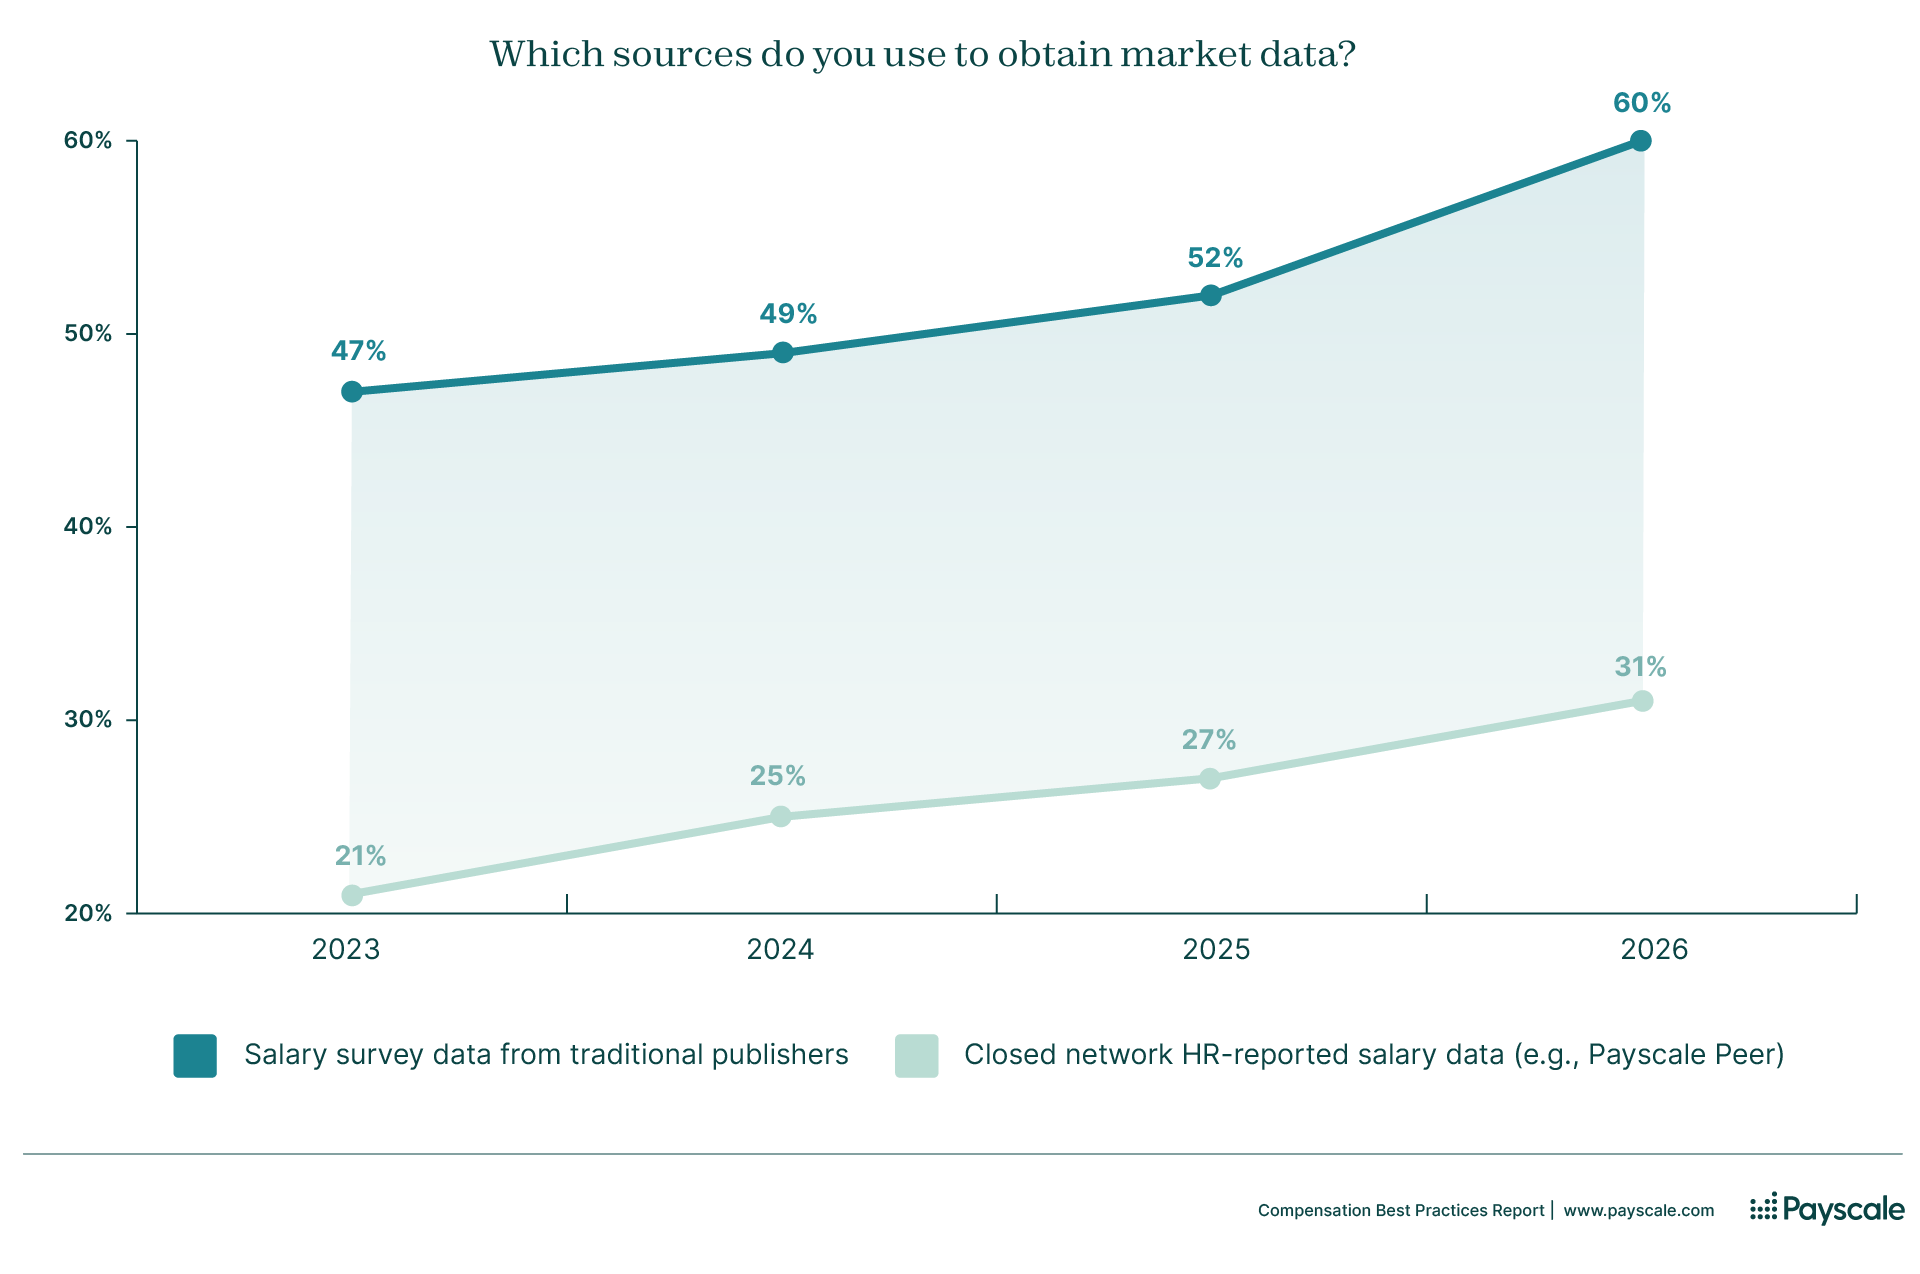
Validated, HR-trusted market data is essential to modern compensation management. According to Payscale’s Compensation Best Practices Report, the average number of salary data sources used by organizations for market pricing is 3.
When it comes to characteristics that make salary data trustworthy, 71% of organizations ranked industry as most important for assessing quality.
While traditional salary surveys continue to be popular and are on the rise as more organizations invest in compensation best practices, industry networks with native survey-quality data like Payscale Peer are also seeing an uplift in usage.
According to our survey, 65% of organizations are confident in their market pricing strategy, which increases to 72% for Payscale customers.
Pay increases and pay-for-performance
As we already reported with our Salary Increase Preview Report, released in January, 48% of organizations are giving merit increases in 2026, but 44% are giving or considering peanut butter pay increases, which is when all employees receive the same pay increase regardless of performance. The average pay increase being given is 3.5%.
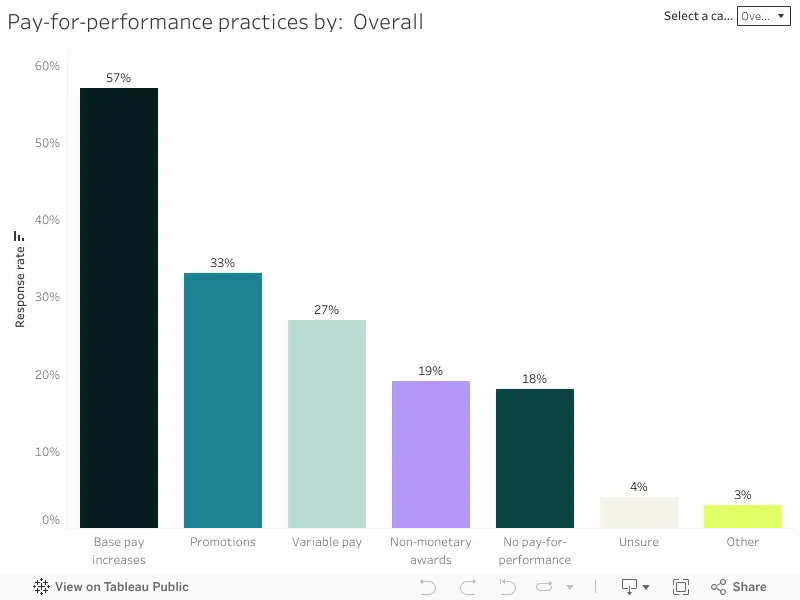
According to the 2026 Compensation Best Practices Report, we also find that only 75% of organizations are committed to giving pay increases at all and 18% have no processes in place to reward pay-for-performance, whether through base pay increases, promotions, variable pay, or recognition.
Despite this, 60% of organizations say they are confident that their pay increases are competitive, which increases to 70% for Payscale customers.
Variable pay and total rewards
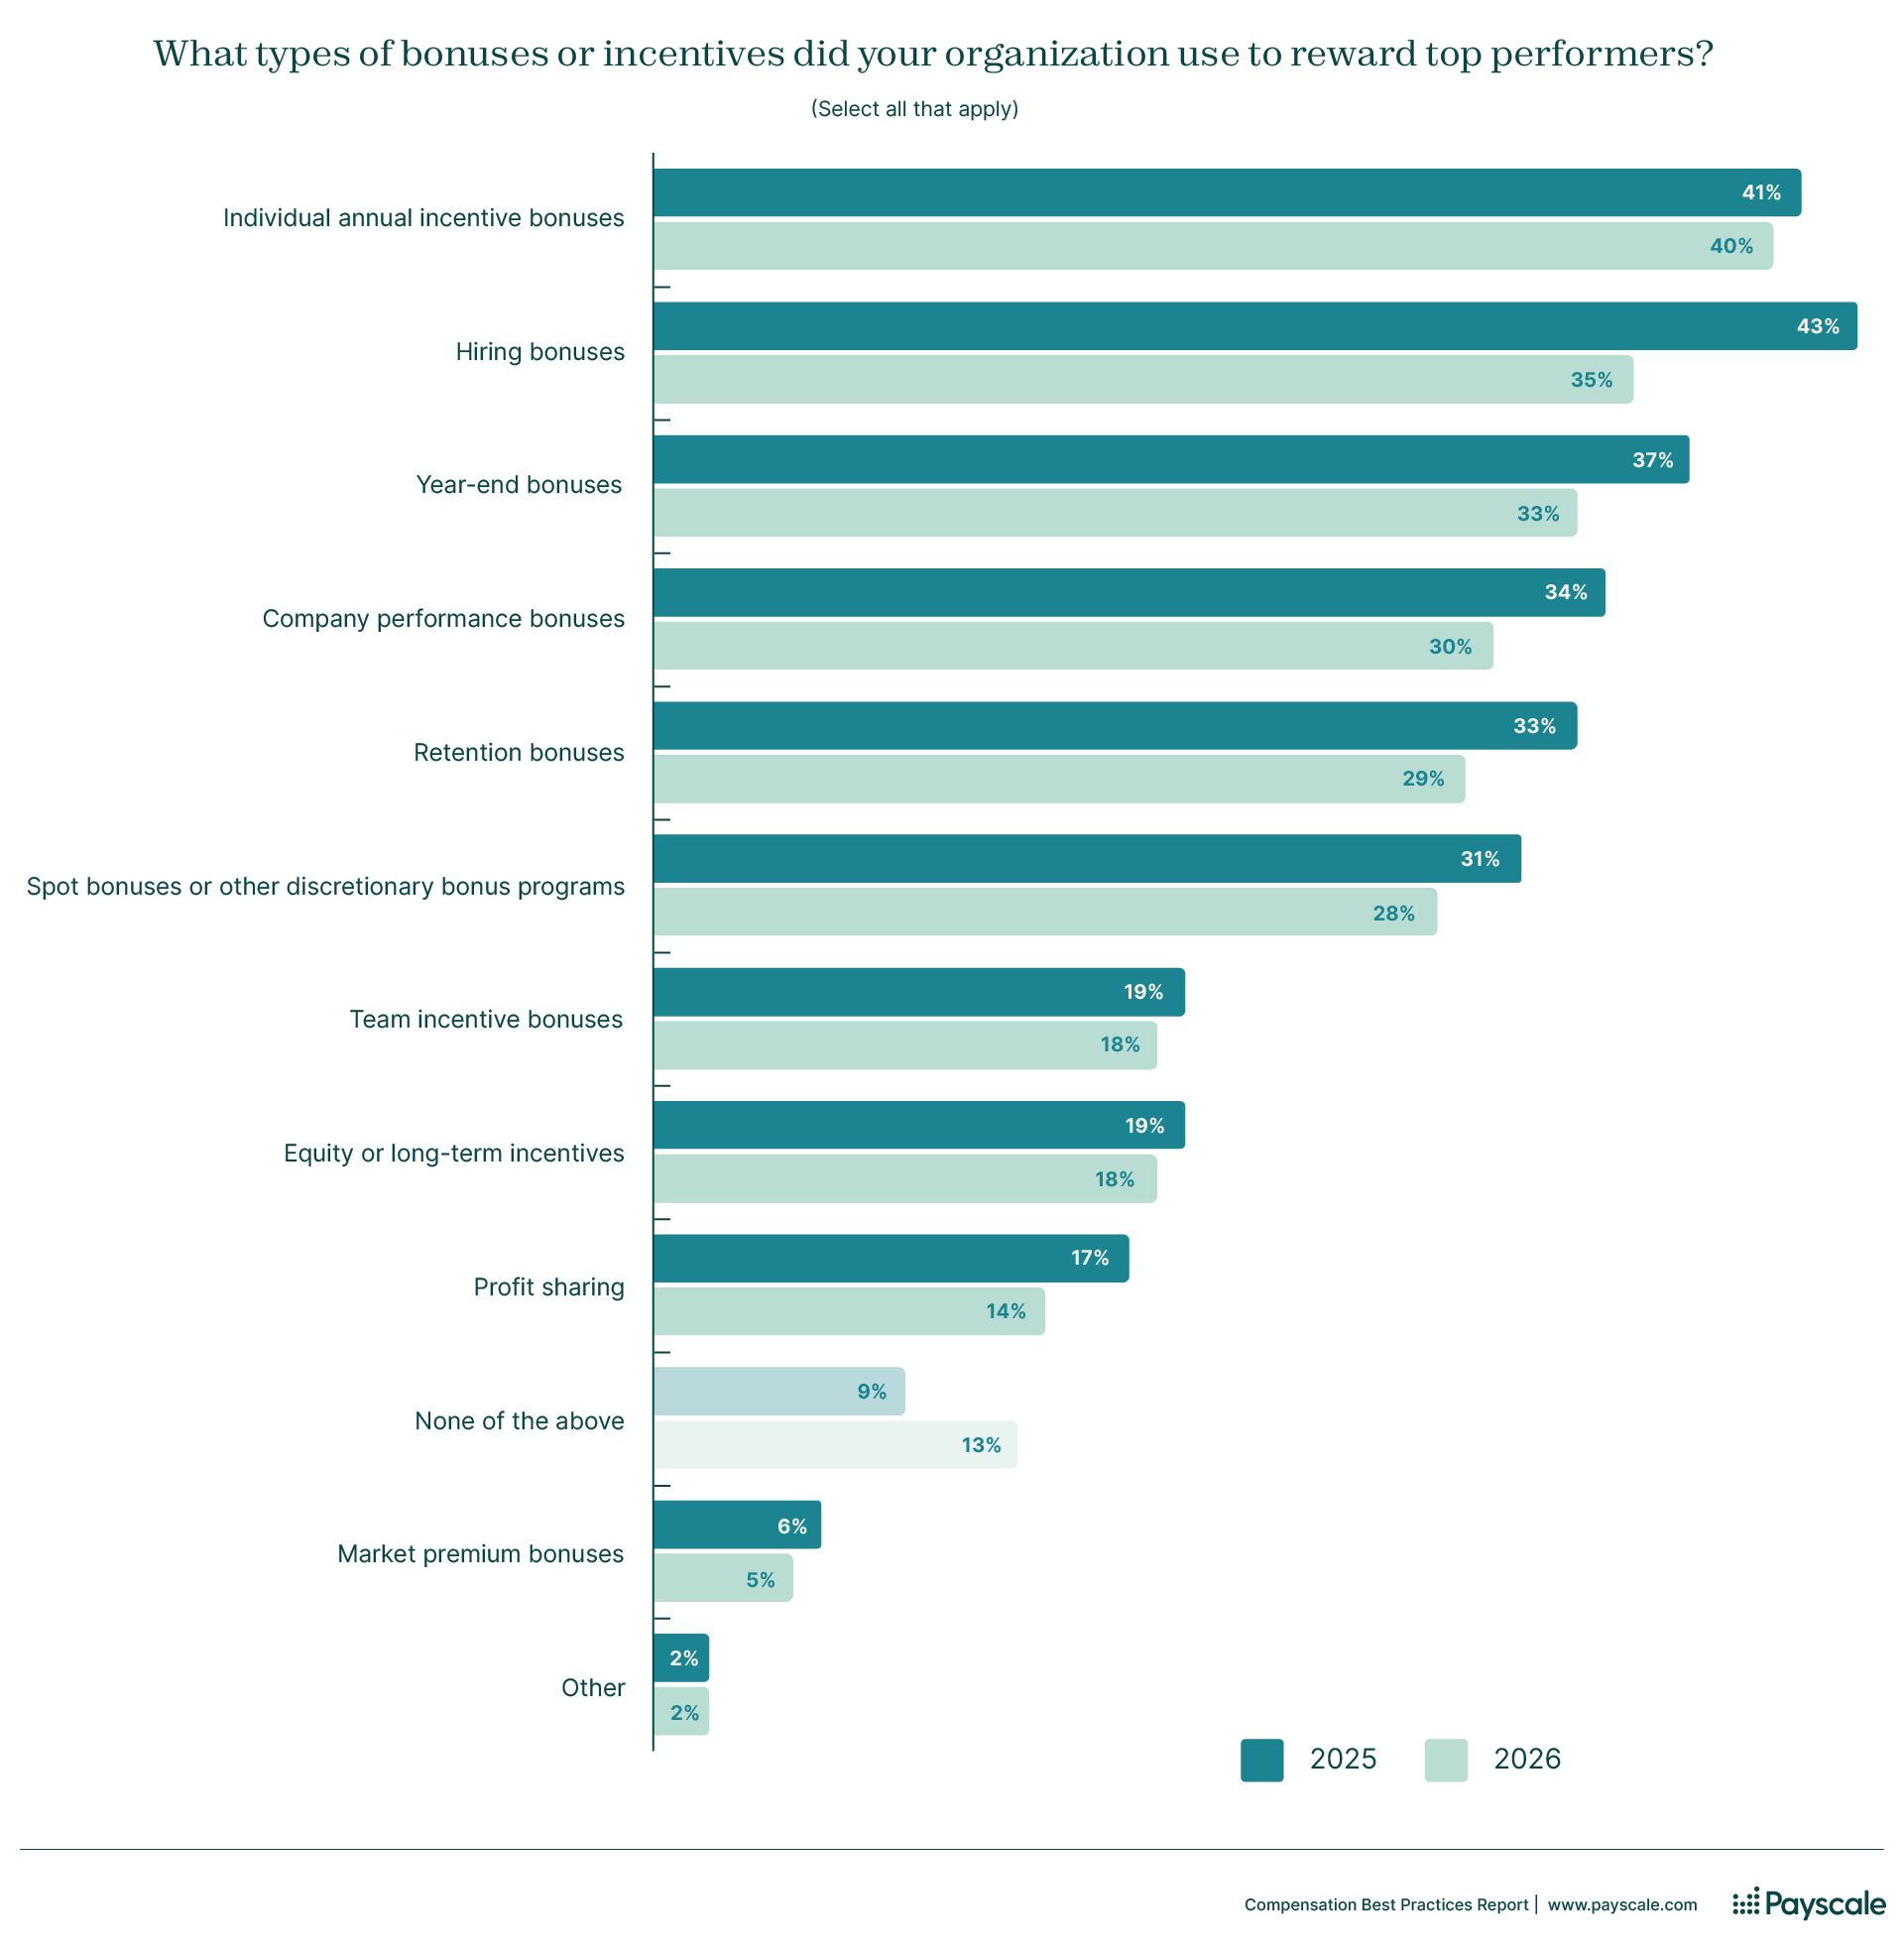
According to Payscale’s 2026 Compensation Best Practices Report, 75% of organizations are giving variable pay in 2026, which is a 6% decline year-over-year and affects all types of bonuses.
In contrast, 61% of organizations say that investment in benefits will remain the same while 16% of organizations say they will be reducing benefits and 14% say they will be expanding benefits. Mental health benefits are the top-cited newly added benefit to stay competitive for 46% of organizations.
Overall, 64% of organizations are confident in their total rewards packages being effective at attracting and retaining talent, which increases to 72% for Payscale customers.
Positive outcomes with pay confidence
By comparing positive outcomes such as reduced voluntary turnover and time-to-fill (open roles) with confidence in pay increases, market pricing, and total rewards, we can measure the impact of compensation best practices.
In our survey, we asked “On a scale of 1-5, how confident are you in your current [market pricing / pay increases / total rewards packages] being effective at attracting and retaining talent?” with 1 being not confident and 5 being very confident.
We also asked: “What was the average number of days required to fill an open position in your organization in 2025?” denoted as time-to-fill, and “What was your average voluntary employee turnover rate in 2025?” denoted as voluntary turnover.
Overall, our analysis finds that time-to-fill and voluntary turnover decreases as confidence in pay decisions increases. In addition, confidence is higher for Payscale customers than non-Payscale customers.
We also compared employee sentiment scores to whether and how employers proactively manage pay adjustments and explain pay decisions to employees.
In our survey, we asked “How would you rate overall employee sentiment at your organization?” with numerical answer choices 1 through 10 where 1 in unhappy and disengaged and 10 is happy and engaged. Similarly to a Net Promoter Score, we rate answer choices 1-6 as Detractors, 7-8 as Passives, and 9-10 as Advocates for the employee experience.
When crossing this analysis with pay communications decision, our analysis shows that confident, proactive pay communications lead to happier, more engaged workers.

Download the 2026 Compensation Best Practices Report
Payscale’s 17th annual Compensation Best Practices Report (CBPR) distills data and insights from the largest known survey on compensation management best practices.Topics covered include: artificial intelligence, labor market, compensation preparedness, compensation software, compensation planning, salary data, job management, benchmarking, compensation strategy, geographic pay, pay equity, pay transparency, and total rewards.

Methodology
The 2026 Compensation Best Practices Survey gathered 3,413 responses from October–December 2025 with a completion rate of 50%. A full breakdown of the methodology can be found at the end of the report.

Top-performing organizations are defined as those that exceeded their revenue goals in 2025 based on a self-selected answer choice in the survey. In this year’s study, 24% of respondents fit this criterion, which is 1% lower than last year (25%) but 3% greater than the year before (21%).
In our survey we asked for participants to provide a number for how many full-time employees there are in their organizations. We separated out six organizational sizes for comparison, with 34% of respondents representing those with fewer than 100 employees, 28% of respondents representing between 100 and 749 employees, 21% of respondents representing between 750 and 50,000 employees, and 2% with over 50,000 employees. The median org size in our study was 290.
The top industries represented in the survey are Healthcare & Social Assistance (11%), Manufacturing (11%), Technology (9%), Construction (7%), and Finance & Insurance (7%).
Respondents to this year’s survey were predominantly in the United States (80%), with 13% in Canada and 7% from other countries, with no other country representing more than 1%.
Respondents were a mix of job levels. Managers or directors made up about half of respondents at 49% combined. C-level executives made up 21% of respondents and VPs 5%. Individual contributors made up 26% of respondents.
Respondents occupied a variety of job functions. While human resources and compensation dominate at 63% combined, we also saw responses from business owners (13%), operations (5%), and other functions.