

Labor market top trends at a glance (Q3 2026)
Wage growth slipped below inflation (3.4%) for the first time this year, turning real pay negative for many workers. Job gains averaged just 51,000 per month — less than half Q2's pace — as the labor market's slow cooling became a sharper deceleration. Technology remains the lone standout at 6.4%, while employer demand rotated away from frontline and hospitality roles toward healthcare, public administration, and AI — a signal that hiring is becoming more credentialed and institutional.
4.5%
wage growth in the Operations job family.
The job family with the lowest wage growth is Warehouse & Supply Chain at 3.4%.
6.4%
wage growth positions Technology as the top industry.
The telecommunications industry has the lowest wage growth at 3.2%.
4.7%
wage growth ranks Las Vegas as the top metro.
Meanwhile, Atlanta, Boston, Philadelphia, Raleigh, and Washington D.C. see the lowest wage growth this quarter at 3.6%.
11.8%
turnover in the Chemicals industry.
Government has the lowest turnover at 1.8%, which is down from 2.0% in Q2.
Top jobs by demand and wage growth in Q3 shift toward healthcare, public services, and AI
Employer demand is rotating away from the frontline operational roles that dominated Q2 toward credentialed, institutional, and AI-adjacent positions. The fastest-growing jobs by pricing are now concentrated in healthcare access, public administration, education, and government affairs — roles that require specialized training and operate within regulated or mission-driven environments. The most notable signal this quarter is the appearance of Artificial Intelligence Director at #9, a more senior AI role than Q2's Artificial Intelligence Analyst (#10).
Employers continue to hire with precision. Organizations are investing in workforce capacity where labor shortages are most acute — particularly in healthcare and public services — while remaining cautious about large-scale workforce growth in a market defined by slow hiring and subdued job gains.
For compensation teams, these roles represent higher flight risk.
Real wages turn negative in Q3
In Q3 of 2026, wage growth now lags inflation. Employees averaged wage increases of 3.1% in Q3 of 2026, while inflation is now 3.4%. Workers who were breaking even in Q2 are now losing ground in real terms. Wage growth has decelerated every quarter this year, from 3.8% in Q1 to 3.5% in Q2 to 3.0% in Q3 at the same time inflation has increased.
Average wage growth
Inflation rate
Real wage growth
.avif)
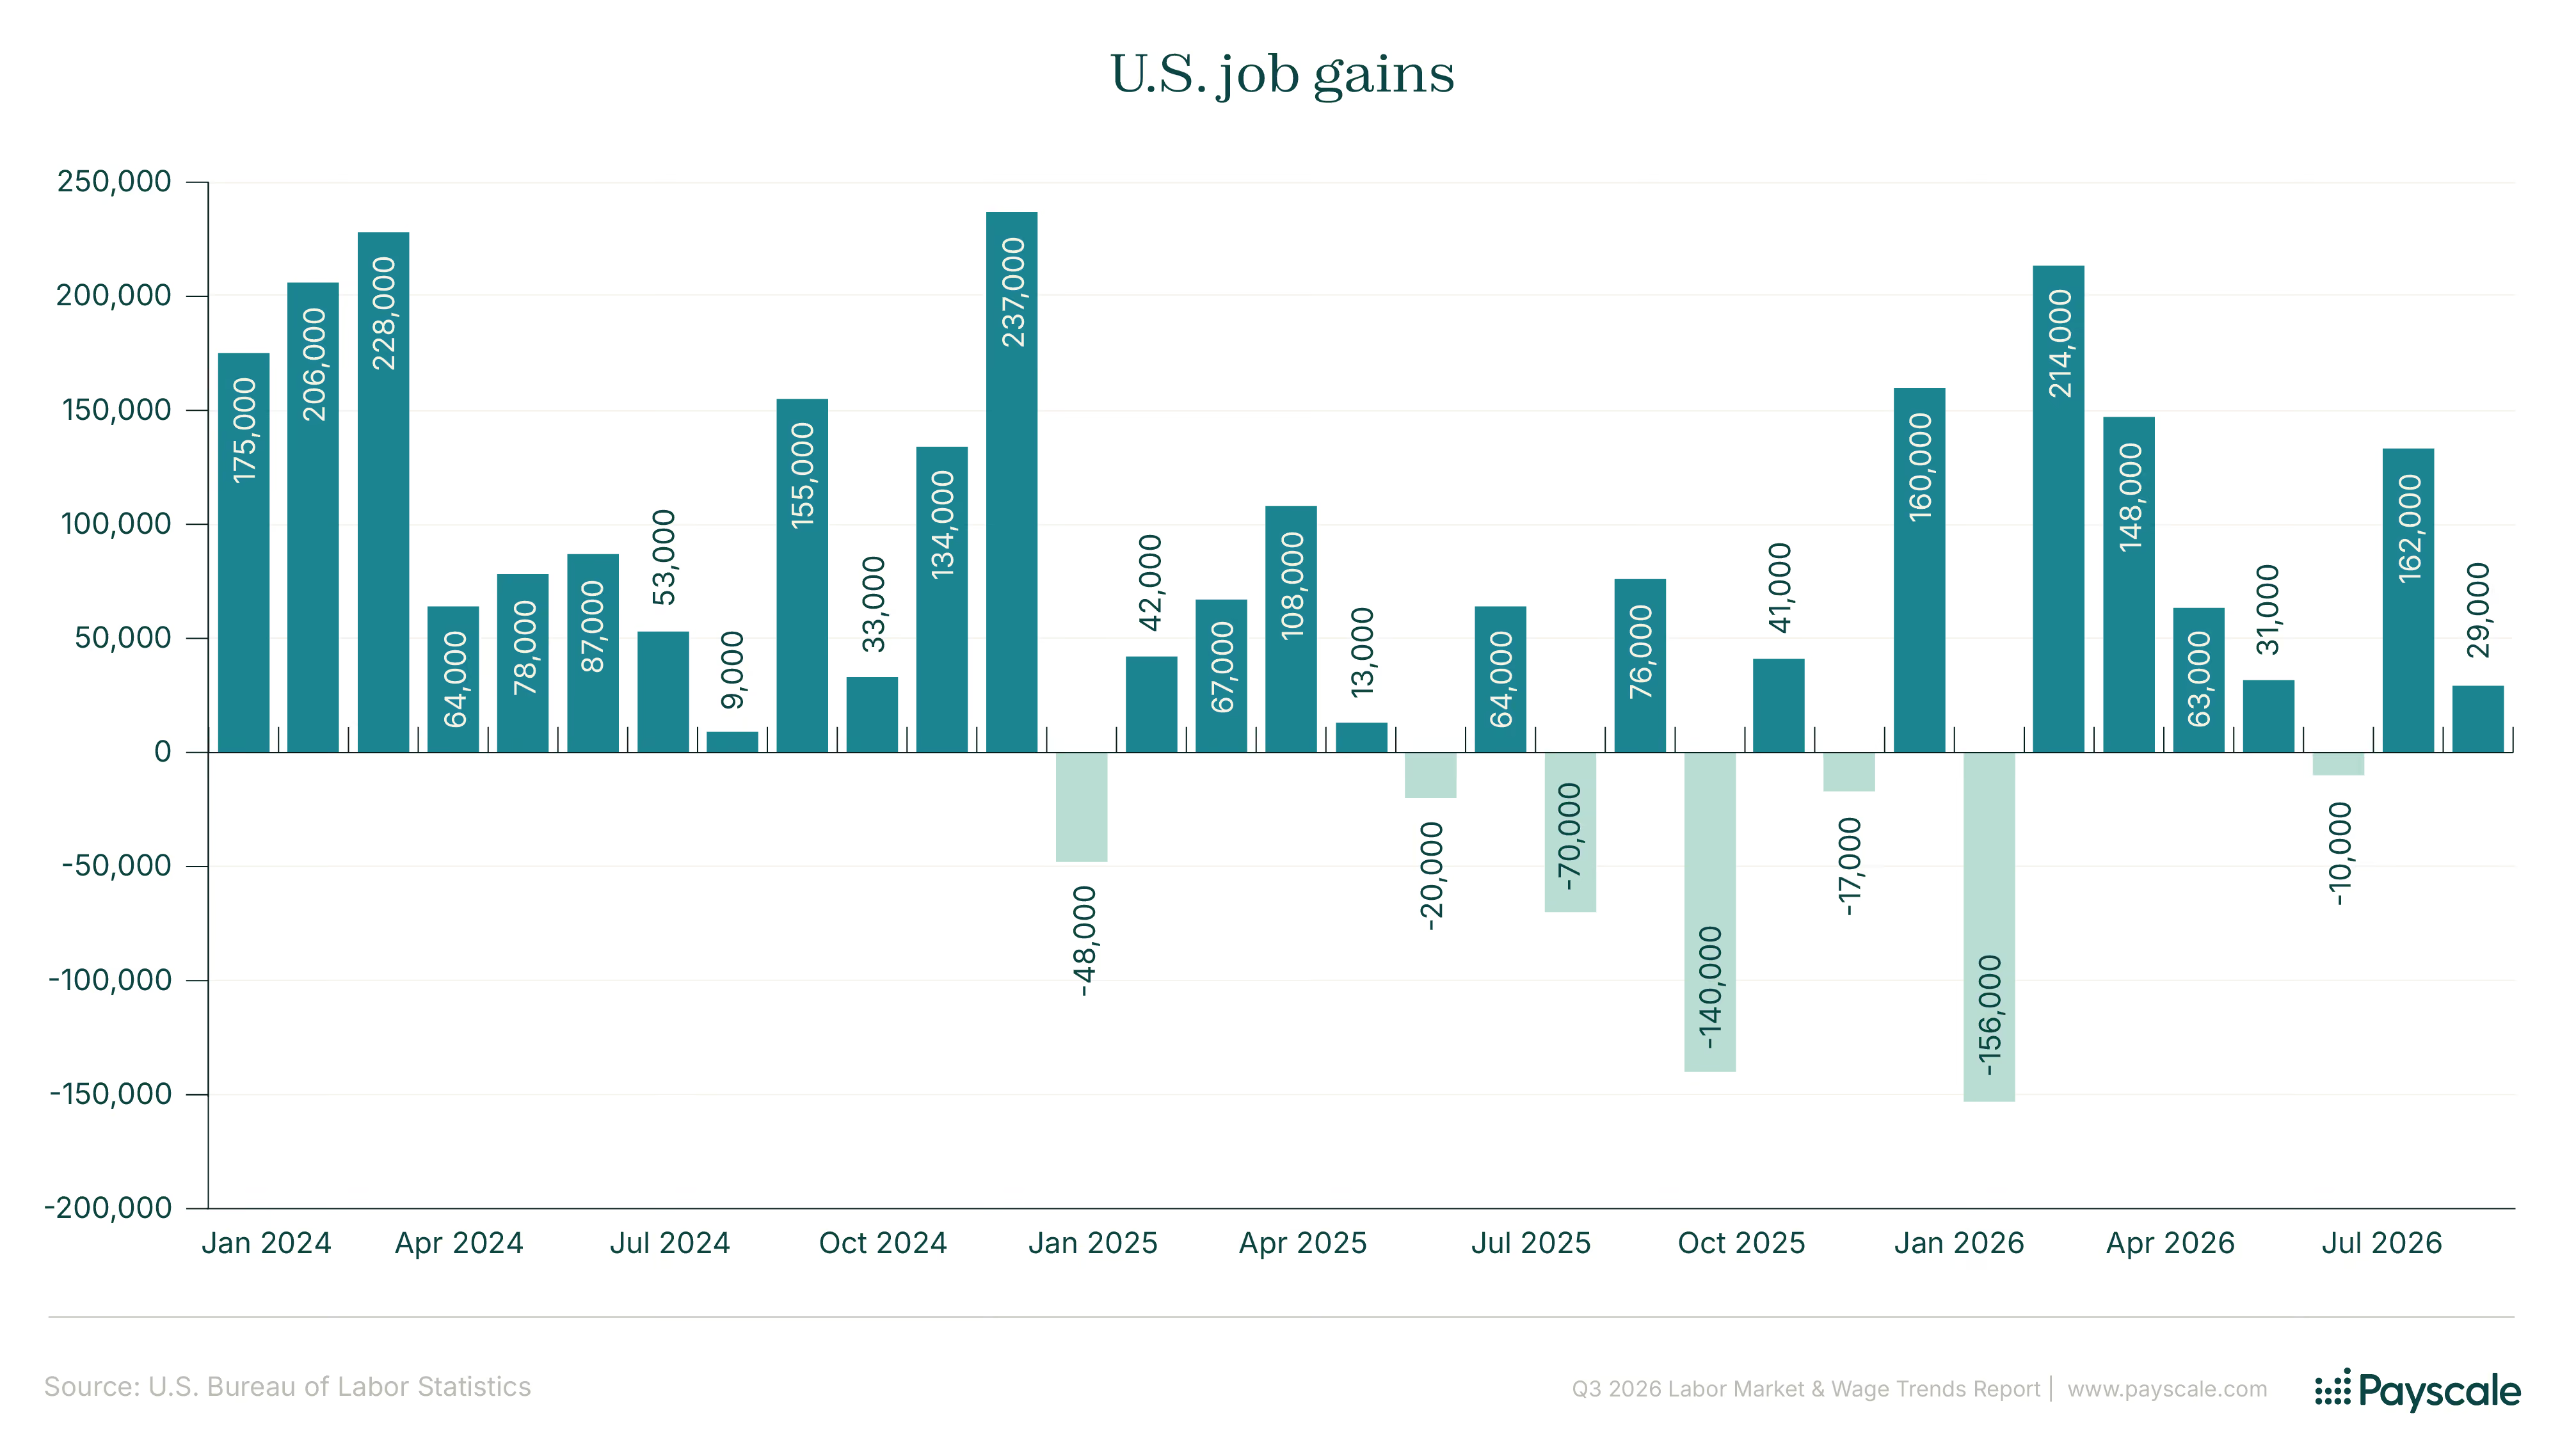
U.S. job gains continue to disappoint
The labor market decelerated further in Q3 2026. July saw a -10,000 jobs loss after a recent correction, August recovered to +133,000, and September fell back to just +29,000, bringing the quarterly average to 51,000 per month. That is less than half Q2's pace and the weakest sustained hiring environment since the labor market began softening. The low-hire, low-fire dynamic continues.
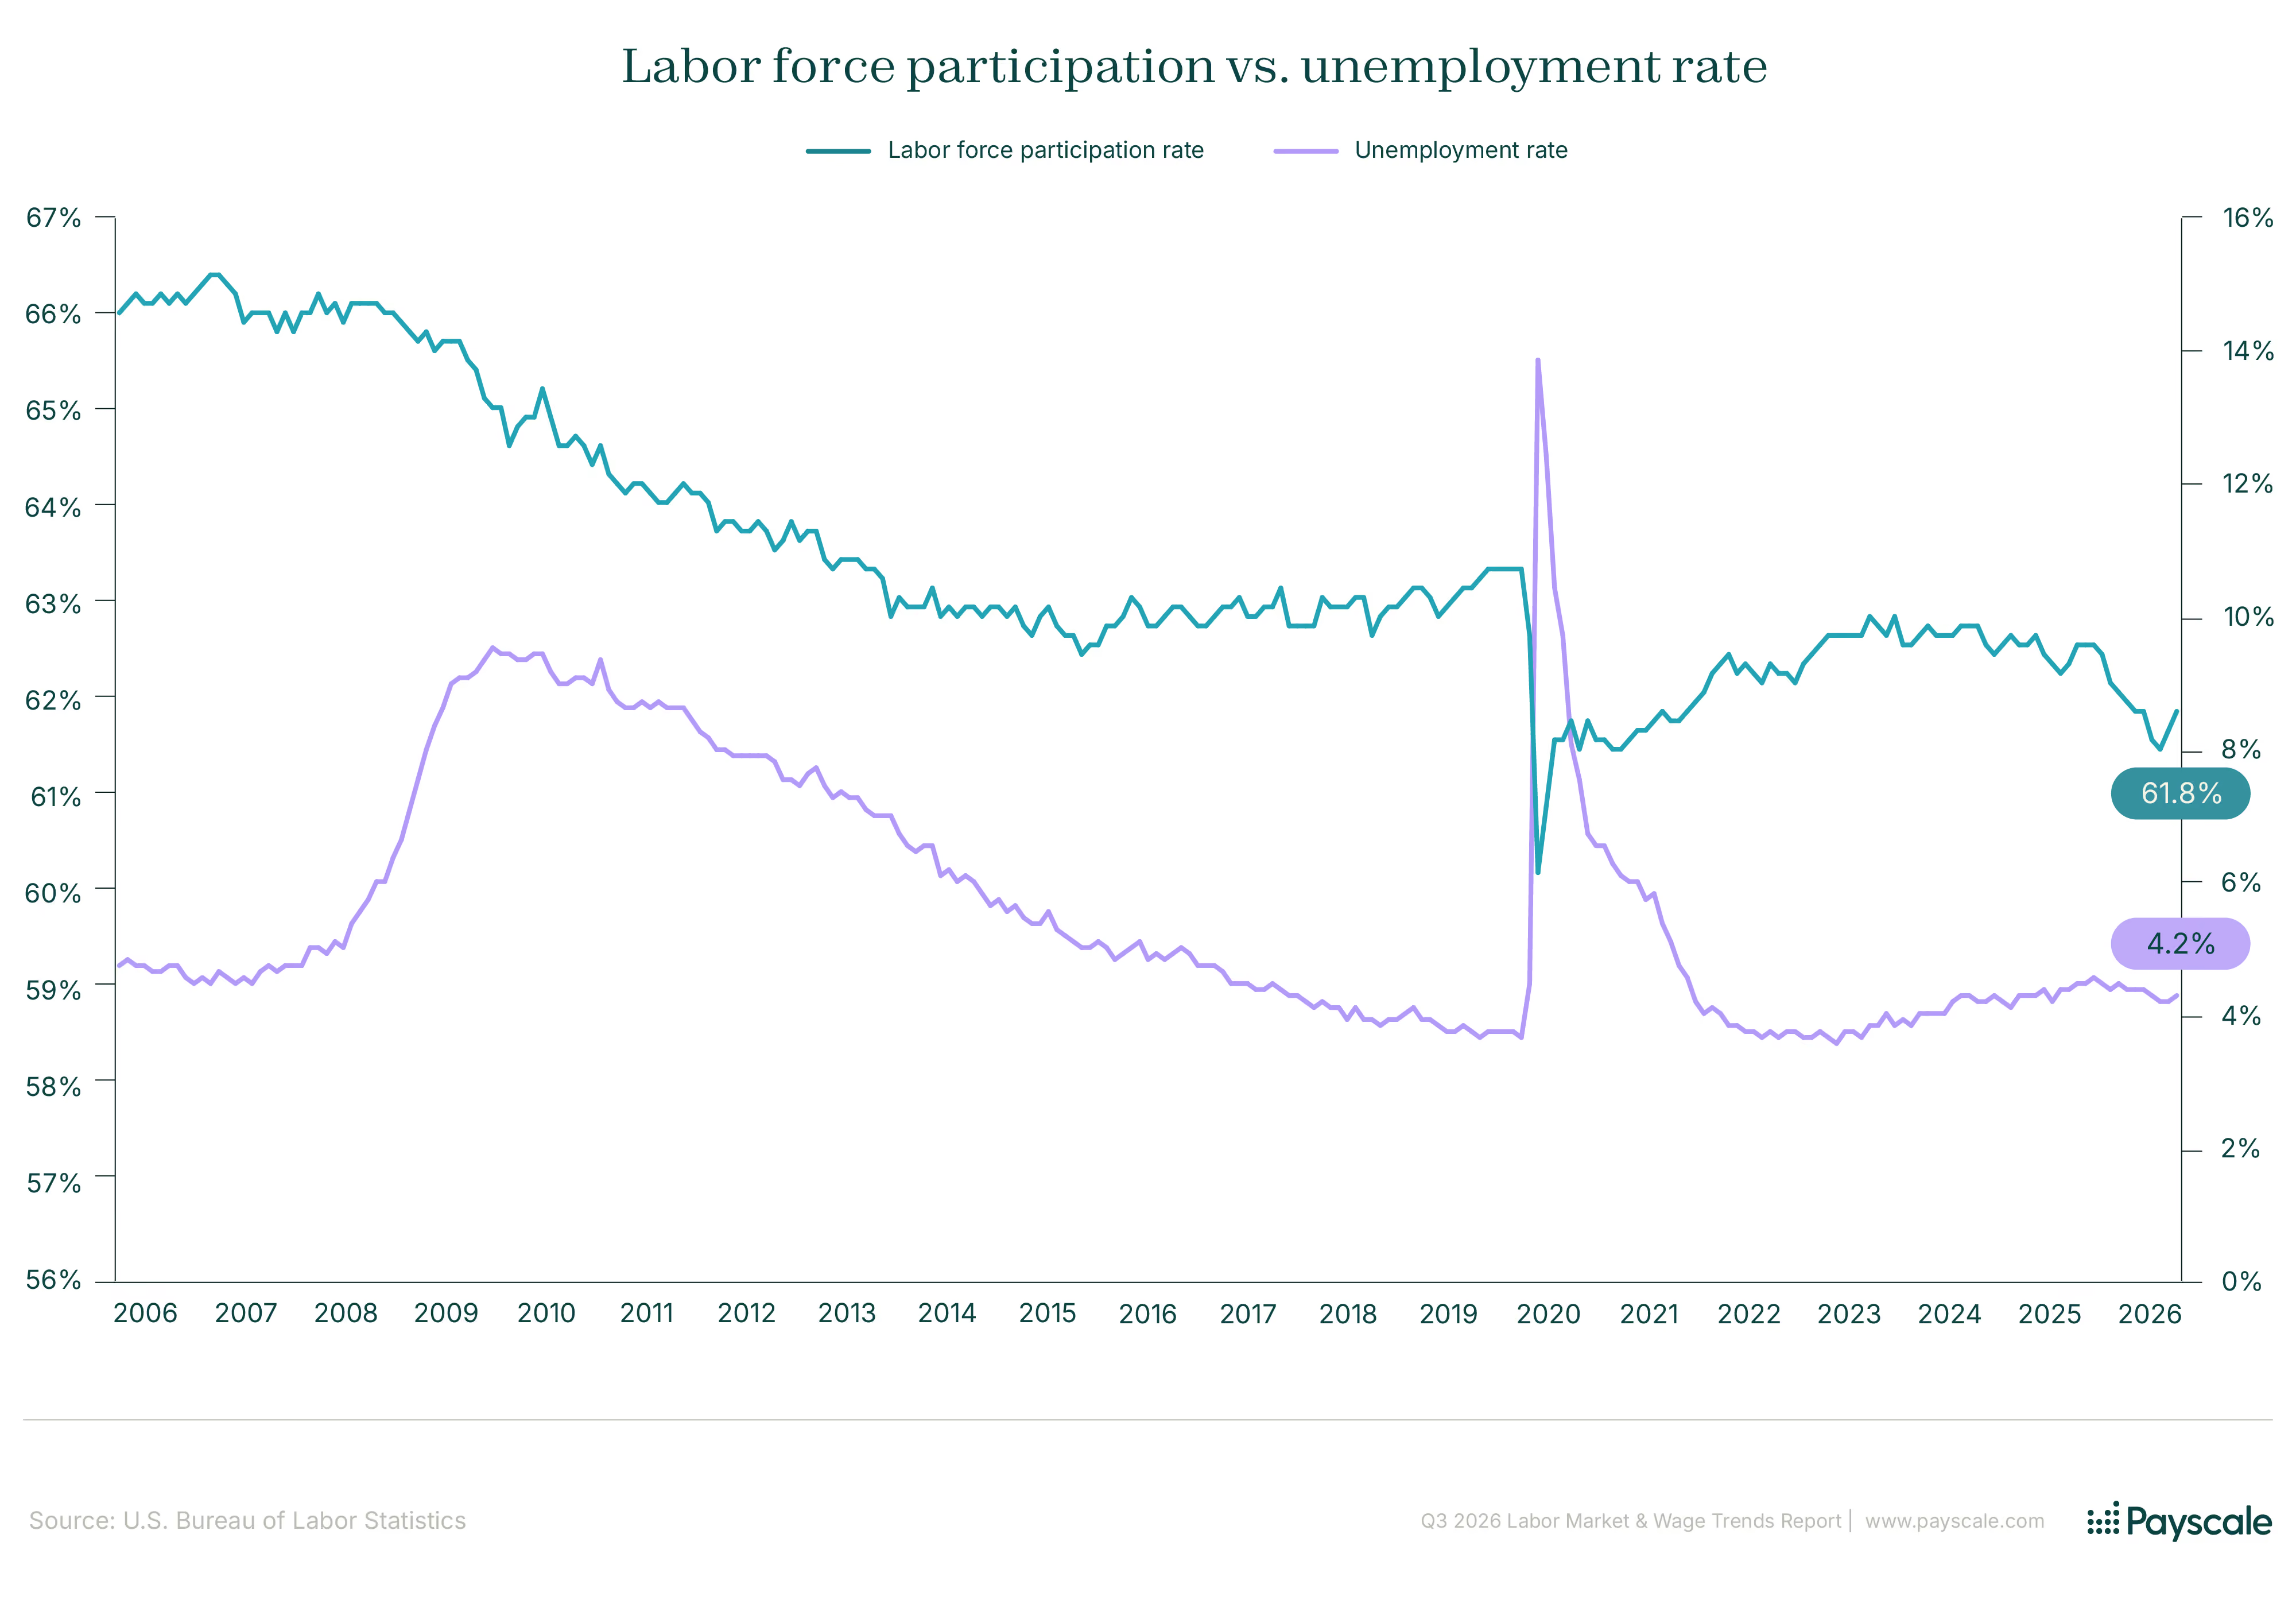
U.S. labor force participation vs. unemployment
The unemployment rate ended at 4.2% in Q3 — flat compared to Q2. Unemployment has waffled throughout the year, and is lower now than in Q1 when it as 4.3%. However, labor force participation has also drifted down slightly, from 61.9% in Q1 to 61.8% in Q3. The two numbers moving together — unemployment contained, participation falling — signals a discouraged workerforce. People aren't being counted as unemployed because they've stopped looking, not because they found jobs.
Download the report (Q3 2026)
Dive into Payscale's quarterly Labor Market & Wage Trends Report.
- Most in-demand jobs
- Turnover by industry
- Wage growth by job family, industry, location, and organizational size
Want instant access to this data to price jobs for your organization? Join a Payscale Industry Network with Peer.


Salary data that moves with the market
Peer data powers Payscale Intelligence Cloud — your modern data ecosystem for benchmarking, job management, and compensation planning. Stay aligned with the market using continuously updated salary data and streamline every compensation decision — from budgeting increases to managing pay programs.
Want to learn more?
Methodology
Payscale derived insights for the Labor Market & Wage Trends Report using Peer, our proprietary data set of fresh, HRIS salary data that features:
- 10.4 million incumbents
- 4,500 Peer network customers
- 45,000 jobs
The data is effective as of October 2026.

Findings in this report are derived from Peer, Payscale’s proprietary survey-grade and HRIS-integrated compensation dataset. Peer is a continuously refreshed database constructed from employer-reported compensation and workforce records submitted directly from HR information systems. Data are at least 90 days old in aggregate, enabling a timely snapshot into labor market conditions rather than relying on dated, annual survey cycles.
Peer data undergo a structured, multi-stage validation process prior to inclusion in the dataset. Participating organizations submit job and compensation records, which are matched to standardized Peer job classifications through AI-assisted job matching technology and manual review. Compensation data are then linked to matched roles and subjected to systematic quality controls, including outlier detection and age-of-data monitoring. Records that fail validation thresholds are excluded. Validated data are aggregated at the job level to generate market benchmarks, and outdated data are routinely removed to preserve temporal relevance while complying with data aging requirements.
Strict confidentiality safeguards govern all reporting. Each published data cut must include contributions from at least five organizations, and no single organization may represent more than 50% of the data within a reporting cell. Automated similarity checks prevent the creation of overlapping data cuts that could risk re-identification. These safeguards ensure that all outputs reflect aggregated market trends while preserving participant anonymity.
Annual base-pay percent change measures the percent change in base compensation for incumbents with valid pay records separated by one year. Only employees with both prior-year and current validated base-pay data are included in the calculation, and only those whose pay has been updated within one year. Individual percent changes are aggregated by data cuts to produce reported wage growth figures.
Turnover rates are calculated at the company level using imputed separations and are then aggregated to industry peer groups. To mitigate distortion from extreme values, prior-year turnover rates are capped at 20% before aggregation.
Employee tenure is derived from reported hire dates and calculated as the difference between the effective reporting date and date of hire. Tenure values are aggregated across job titles, levels, industries, organization sizes, and geographic segments to provide comparative workforce stability metrics. Records with incomplete or implausible hire data are excluded from tenure calculations.
Job pricing growth (i.e. demand growth) reflects the year-over-year percent change in priced jobs by job title. This measure captures shifts in commonly priced jobs and helps identify roles experiencing elevated demand or supply constraints. Only validated and sufficiently populated job groups that meet anonymity thresholds are included in trend analysis.
BLS Metrics Labor market metrics including job gains, wage growth versus inflation, unemployment, and labor force participation are sourced from the Bureau of Labor Statistics (BLS).
Payscale is the pioneer of compensation intelligence, helping organizations make smarter pay decisions that drive business performance. For more than 20 years, Payscale has combined trusted market data with AI-powered technology to deliver actionable insights that turn pay from a cost into a catalyst for growth. The Payscale Intelligence Cloud portfolio of solutions — Ascent, JobNav, and Paycycle — empower top companies and businesses like Cintas, Leidos, Chipotle, Ohio State University, and TJX Companies.
Create confidence in your compensation. Payscale.
To learn more, visit www.payscale.com.
Are you a journalist looking for wage trends and salary data insights to inform a story? Email us at press@payscale.com.
Frequently asked questions

Wage growth is influenced by supply and demand for labor. When employers compete for workers, they raise wages to attract and retain employees. Conversely, if unemployment rises or hiring slows, wage growth tends to moderate. After the pandemic, wage growth spiked but has since slowed to around 3–4% annually as labor demand cooled. Positions with skill shortages and more competition see higher wage growth.
Inflation affects wage growth by influencing both workers’ expectations and employers’ compensation decisions. When prices for goods and services rise, workers often seek higher wages to maintain their purchasing power, prompting employers to raise pay to attract and retain employees. However, if wages grow slower than inflation, workers experience a decline in real income even if their nominal pay increases. In tight labor markets, inflation can contribute to faster wage growth as firms compete for workers, but if wage increases become too rapid, they can also reinforce inflation by raising businesses’ costs and potentially leading to higher prices.
Moderate wage growth (often around 3–5% annually) is seen as healthy because it supports rising living standards without creating excessive inflation. Extremely fast wage growth can push businesses to raise prices, while very slow wage growth can weaken consumer spending and economic growth.
Wages can still rise when hiring slows because companies may raise pay to retain existing employees. Firms often prefer paying current workers more rather than facing the cost of recruiting and training new ones. Productivity improvements or inflation can also contribute to wage increases even if employment growth weakens.
Labor demand refers to how many workers employers want to hire at different positions and wage levels. It depends on factors such as economic growth, consumer demand, productivity, and technology. Economists often measure labor demand using job openings, hiring rates, and employment growth. When labor demand rises, job openings increase and unemployment typically falls.
Labor supply depends on demographics, immigration, education, and labor force participation. An aging population, changes in immigration levels, and shifts in retirement patterns can all affect how many workers are available in the economy. These factors influence wage growth by altering how tight the labor market becomes.
The unemployment rate measures the percentage of people in the labor force who are actively looking for work but do not currently have a job. In contrast, the labor force participation rate measures the share of the working-age population that is either employed or actively seeking employment. The key difference is that the unemployment rate only includes people who are participating in the labor market, while the participation rate also reflects how many people have chosen to work or look for work at all.
Yes. The unemployment rate can decline if people stop looking for jobs and leave the labor force entirely. When someone is no longer actively searching for work, they are no longer counted as unemployed and are instead considered “not in the labor force.” As a result, the unemployment rate may fall even if employment does not increase, which is why economists often look at the labor force participation rate alongside unemployment to better understand overall labor market conditions.
When job openings exceed available workers, employers often increase wages or benefits to attract applicants. This happened in 2021–2022 when the number of open jobs surged. As job openings decline, wage pressure tends to ease because employers face less competition for workers.
Worker turnover is the rate at which employees leave jobs and are replaced by new hires. It includes voluntary quits, layoffs, and other separations. High turnover often reflects a dynamic labor market where workers can easily move between jobs, while low turnover may indicate uncertainty or fewer opportunities. Organizations with attractive cultures, opportunities, and compensation strategies tend to see lower turnover.
The quit rate measures how many workers voluntarily leave their jobs. A higher rate of quits reflects worker confidence: when workers believe better opportunities exist, they are more likely to search for higher pay or better conditions. When the economy slows, quit rates usually fall because workers become more cautious about leaving stable employment. Employers should be careful not to infer that low voluntary turnover is reflective of their success at building a great place to work when macroeconomic conditions mean that turnover has dropped everywhere.
Industries such as hospitality, retail, and food services often have the highest turnover rates because jobs tend to be lower-paid, seasonal, or part-time. In contrast, fields like government, education, and specialized professional services typically experience lower turnover due to higher job stability and benefits.