✦ Benchmarking Solutions

Intelligence that turns compensation from reactive to intentional

500+ 5 Star Reviews

Learn how Payscale's solutions deliver fresh market data, AI-guided pricing, and defensible methodology — so every benchmarking decision is faster, smarter, and connected to the rest of your compensation strategy.

Get a Demo
1Define
2Benchmark
3Align
4Publish
Choose the jobs to price
Select roles and Smart Price preps them for benchmarking — no setup required.
Account Manager
10600-CNS · Sales · USA — National
Accountant I
10007-CNS · Accounting · USA — National
Sales Analyst I
JC10546 · Sales · USA — National
Director, Finance
10031-CNS · Finance · USA — National
JOBS SELECTED
26
of 328 jobs · 114 employees
ANNUAL SPEND
$8.7M
Avg. salary $76K
82
Readiness score
Ready to benchmark
AI matches every job to market
One click maps your title to verified market data — with a confidence score.
MY COMPANY JOB
Account Manager
10600-CNS Sales USA — National
↓  AI Match
Account Executive II
Payscale Verse · USA — National
91
MARKET DATA · 25TH–75TH PERCENTILE
10TH25TH50TH75TH90TH
$72,459$92,742$119,474
Catch risk before you publish
Smart Price surfaces above-range pay and compression so you can act early.
Above-range employees
141% INDEX
Buyer · 60028-CNS · USA — Seattle · 4 employees above the 90th percentile
Keanu Sanford$116,350ABOVE RANGE
Jayson Winfred$120,500ABOVE RANGE
Jovani McCall$134,350ABOVE RANGE
Alphonso Jordan$138,500ABOVE RANGE
Equity signal
4 employees flagged. Smart Price surfaces compression risk before publish — adjust ranges or model exceptions first.
Publish with confidence
A defensible, costed plan — ready to roll out across the org.
JOBS PRICED
26
of 328 · 114 employees
ANNUAL SPEND
$8.7M
+$736.9K to reach target
MIDPOINT MOVE
+45.3%
from prior benchmark
THE PAYOFF
Confident pricing, end to end.
Price like a pro
AI guidance at any skill level
Confidence you can trust
Proven AI, transparent logic
More time for strategy
Less pricing, more impact

Benchmarking is under more pressure than ever

Most compensation teams are still wrestling with manual processes, outdated survey data, and tools that weren’t designed for the speed or complexity of today’s market.

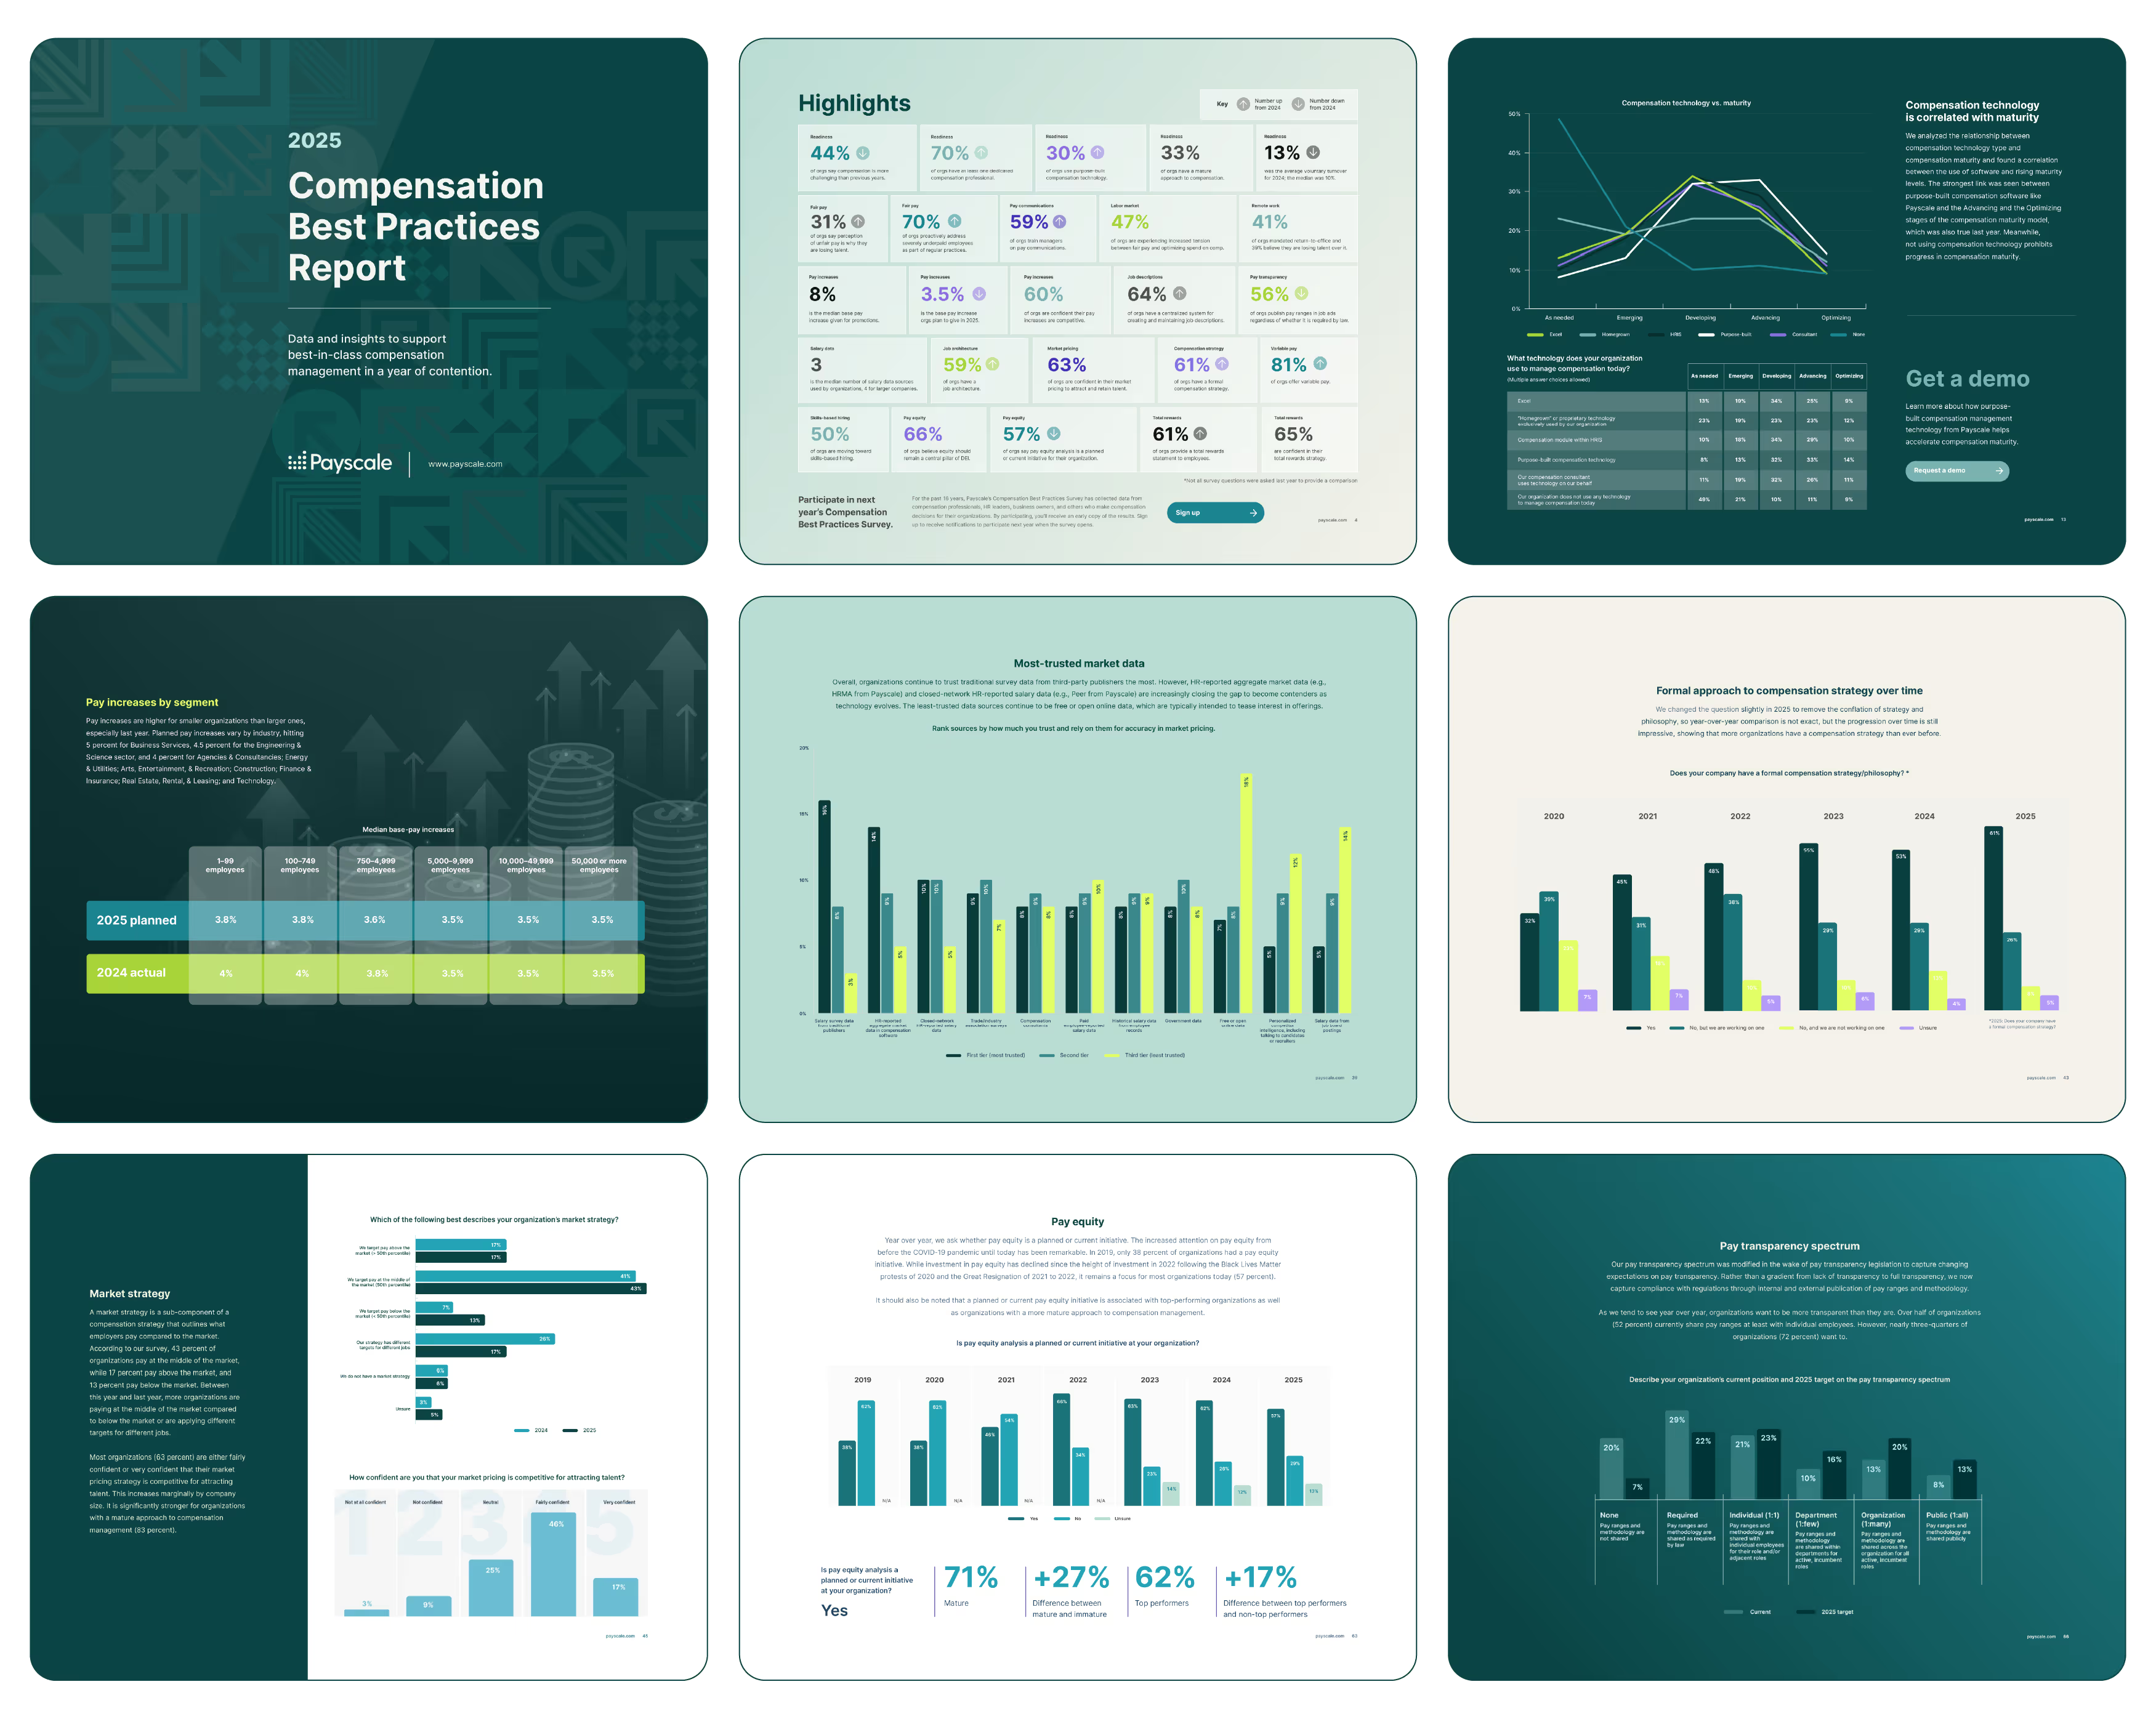
Yet according to Payscale’s 2026 Compensation Best Practices Report, compensation teams cite increasing pressure to move faster while maintaining accuracy and governance.  

64
%

of organizations still rely heavily on spreadsheets for market pricing and pay equity analysis

65
%

of organizations are confident in their market pricing strategy

47
%

of organizations experience increased tension between ensuring fair pay and optimizing compensation spend

Powered by
29
Industries
10M+
Employee Records
4.5K+
Contributing Orgs
00+
New Metric 5
00+
New Metric 6
00+
New Metric 7
00+
New Metric 8
Built for
Benchmarking
Compensation Planning
Job Management
Pill 4
Pill 5
Pill 6
Pill 7
Pill 8
Made for
Compensation Professionals
HR Professionals
Executive Leadership
Talent Acquisition
Pill 5
Pill 6
Pill 7
Pill 8
✦ Meet the Payscale Intelligence Cloud

One connected system. Every benchmarking decision smarter.

When you activate continously refreshed compensation intelligence across benchmarking, job architecture, and compensation planning, you eliminate version conflicts, manual reconciliation, and decisions made in isolation.

One connected foundation

Your benchmarks don’t live in isolation. The same defensible data that powers Ascent flows directly into job management and compensation planning solutions— so job structures, leveling, and descriptions stay consistent with your market data without forcing your team to re-enter or reconcile anything.

Grounded planning

Compensation planning should reflect reality, not last quarter’s assumptions. Paycycle runs on the same live, trusted benchmarks you use in Ascent — so modeling, budgeting, and pay decisions are grounded in current market conditions from the start.

Integrated insights

Stop switching between tools to understand your data. Real-time market intelligence and AI-guided recommendations surface directly inside Ascent — and flow into the workflows your team already uses for planning and job management.

✦ How we help

Benchmarking that stays current when the survey cycle turns off

✦ Pricing at scale

Ditch the spreadsheets. Let AI do the heavy lifting.

What happens when you bring Intelligence to your benchmarking strategy? Faster pricing. Deeper insights. Zero guesswork.

Price hundreds of roles in minutes instead of days

Trusted agentic AI surfaces transparent, defensible pay recommendations with clear “why” explanations so you can review, adjust, and move forward with confidence.

Get answers in plain English, instantly

Ask natural questions and receive dynamic, real-time compensation intelligence — compare jobs, analyze trends, model scenarios, and uncover hidden opportunities across your pay program without digging through reports.

Eliminate manual matching errors and guesswork

.Intelligent job-to-survey matching learns from your data and delivers smarter recommendations with richer context for every pricing decision.

1AI Search
2Market Pricing
3Trends & Demand
Find any job, fast
Search in plain language — Payscale maps it to the right role and market.
AI-powered search
Firmware / Embedded Software Engineer
Technology USA — National 500–1,000 employees
Suggested matches
Firmware Engineer II
USA — National · Technology
Embedded Software Engineer
USA — National · Technology
IoT Firmware Developer
USA — National · Technology
Price the role in real time
A live pay distribution, benchmarked to fresh market data.
Market distribution
Firmware / Embedded Software Engineer · USA
10TH 25TH 50TH 75TH 90TH $88.1K $96.2K $107.2K $132.8K $158.9K
50TH · MEDIAN
$107.2K
Range
$88K – $159K
10th to 90th percentile
Data analyzed
Firmware/Embedded SW Eng · USA 98 orgs · 2,221 incs
Firmware/Embedded SW Eng · Technology 10 orgs · 134 incs
Explore trends and demand
Skill premiums, hiring momentum, and where the jobs are.
Skill impact
Pay lift for in-demand skills
Embedded C/C+++12%
RTOS+8%
Device drivers+5%
Bluetooth LE+3%
Skill trends
% of postings, last 7 quarters
Embedded C/C++ RTOS Device drivers Bluetooth LE
Demand · job postings
Postings over last 8 quarters
Q2 ’24Q4 ’24Q2 ’25Q4 ’25
Demand · top locations
Postings & median by metro
San Jose, CA532$195.1K
Los Angeles, CA309$167.7K
Seattle, WA188$176.6K
Boston, MA182$145.2K
1Ask Anything
2Analyze Insights
3Drive Decisions
Query data, in plain language
Ask the way you'd say it — get a report back.
Generate a report showing pay equity by department
Asking about: Compensation data
Ask
Try asking
Average compa-ratio by job family?
Top 10 jobs with low pay outliers?
Who's paid below their range minimum?
Which jobs aren't market-priced?
New-hire vs. tenured pay in the same title?
Surface key findings
Your question becomes a live, drillable report.
Show gender pay gaps by department, descending
Pay gap by department
Sales
−3.2%
Engineering
−2.4%
Marketing
−1.8%
Finance
−1.1%
Operations
−0.6%
Avg. gap closed
−2.1%
YoY across all departments
Employees above midpoint
68.4%
4.2 pts vs last quarter
Roles ready to price
1,247
Updated this morning
Benchmark with confidence
Analysis becomes a defensible, costed action plan.
Market intelligence
Insight
Engineering salaries trail market by 3.8% — top-quartile risk in 14 roles.
Pay equity signal
Insight
Gap closing fastest in Marketing — −1.8% YoY. Sales needs attention next.
Recommended action
Act now
Allocate $420K across 14 engineering roles to close the gap and protect retention.
Projected outcome
Retention up. Risk down. Budget defended.
22%
Lower flight risk for top performers
$1.4M
Avoided cost of unwanted attrition
Reporting & Insights

Price with confidence using data that’s current — and insights that are instant.

Daily-refreshed market data signals with full traceability, plus the ability to query and explain that data in seconds.

Make decisions on data that reflects the market today

Foundational Peer data refreshes daily with new pay changes, new roles, and new participating organizations — without waiting on annual survey cycles.

Close coverage gaps on fast-moving roles and emerging skills

Real-time job posting signals and AI-enhanced layers keep your benchmarks accurate even when the market shifts quickly.

Turn fresh data into clear answers fast

Smart Reporting lets you ask natural questions and get governed, explainable insights in seconds — so you can price confidently and defend recommendations to leadership without manual report building.

Services & Support

Bring in the experts. Move faster.

Complex projects don’t have to slow you down or create risk. Get deep expertise in benchmarking, pay equity, and implementation exactly when you need it — without adding permanent headcount.

Turn messy or high-stakes data into clear, defensible recommendations.

Get custom benchmark studies and expert interpretation support when the analysis gets complicated or the stakes are high.

Move from diagnosis to action on pay equity with confidence.

Work with specialists who know how to identify real gaps, model remediation scenarios, and build plans that actually hold up under scrutiny.

Get your team up to speed fast without the usual rollout chaos.

Hands-on implementation training and change management support so new benchmarking workflows stick — and deliver value quickly.

1Identify
2Model
3Implement
Identify the gaps
Experts pinpoint real, statistically significant pay gaps in your data.
Expert-led analysis
PAY EQUITY DIAGNOSIS
Group A$104,200
Group B$95,900
−8%
Statistically significant gap flagged
Surfaced from your data, not a rule of thumb
Model the fixes
Specialists model remediation scenarios — costed and ready to act on.
Scenario modeling
REMEDIATION SCENARIO
Group A$104,200
Group B$103,800
Gap closed — modeled to cost
Adjustment: +$148K across 32 employees
Implement with confidence
Hands-on rollout and a defensible record — so the plan holds and sticks.
Change management
IMPLEMENTATION & CHANGE MANAGEMENT
A plan that holds up.
Documented methodology
Every decision traceable end to end
Audit-ready evidence
Holds up under scrutiny
Trained on your real data
Workflows stick, value lands fast
From flagged gap to defensible, implemented plan — without adding headcount.
✦ Who we help

Right-sized intelligence for every stage

Whether you’re building your first structured compensation process or running sophisticated global programs, Payscale Ascent scales with your maturity and complexity — without forcing you to overbuy or under-serve.

Compensation professionals

For teams who want to move from reactive pricing to proactive, defensible strategy.

Learn more

HR professionals

For HR leaders who need reliable benchmarks without becoming compensation experts overnight.

Learn more

Talent acquisition

For recruiting teams who want fast, compliant, market-backed offers without waiting on comp.

Learn more

Executive leadership

For leaders who need clear, defensible answers they can stand behind in the boardroom.

Learn more
✦ Customer success

Don’t just take our word for it

Hear from leaders how Payscale delivers for clarity, scale, and trust in their compensation strategy.

500+ 5 Star Reviews

Enterprise-grade security & partnerships

Strategic partnership with Trusaic for advanced pay equity remediation when deeper analysis is required.

Ready to move from reactive benchmarking to continuous compensation intelligence?

See how Payscale Ascent helps compensation teams reduce manual work, get fresher data, and make faster, more defensible decisions that connect across your entire compensation strategy.

Get a Demo